Bespoke’s Weekly Sector Snapshot — 8/19/21
The Bespoke 50 Top Growth Stocks — 8/19/21
Chart of the Day – What Do Individual Investors Know That The Market Doesn’t?
One of the Best Weeks of the Year for Claims
Initial jobless claims hit another pandemic low this week dropping to 348K from last week’s 2K upwardly revised reading of 377K. That was also 16K below expectations and the first better than expected print in six weeks. While recent releases have disappointed relative to forecasts, this week did mark the fourth week in a row that claims have dropped. That is the longest stretch of consecutive declines since a six-week streak ending on June 4th.

On a non-seasonally adjusted basis, initial claims fell to 308.57K which is again the lowest level since the start of the pandemic. Meanwhile, pandemic unemployment assistance claims ticked up to 109.38K from 103.85K the previous week. The main state driving that increase was Ohio which saw claims more than double. Maryland, Oregon, and California were the other states to have seen the biggest increase in PUA claims. Those increases also come even as the program is slated to end in just two weeks on September 4th.

As for the decline in claims for unadjusted regular state programs, we would caution against reading too deep into the number on account of strong seasonal tailwinds. As shown below, the current week of the year (33rd) is tied at second for the week of the year that most often sees claims decline. As shown in the second chart below, there has only been one year, last year, in which claims were higher week over week in the 33rd week of the year.

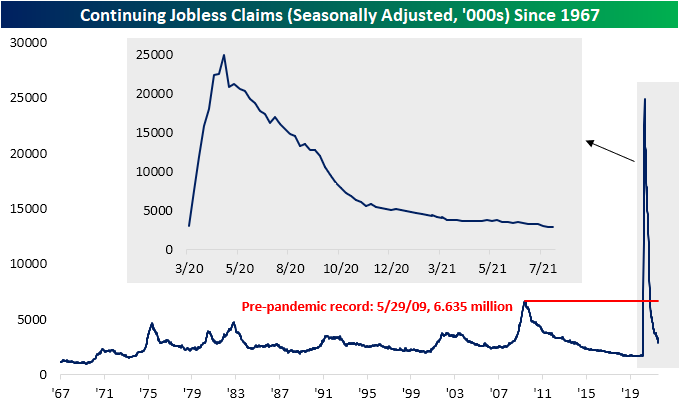
Seasonally adjusted continuing claims missed expectations by 20K this week, but at 2.82 million, this week’s reading still marked a third consecutive decline. As such, claims are still at the lowest level of the pandemic and are closing in on coming within one million from the March 2020 levels.
While the most recent reading on continuing claims was lower, purely looking at regular state claims does not show the full picture. Including all other programs creates some additional lag meaning the most recent data is through the last week of July. Through that week, total claims fell below 12 million for the first time of the pandemic, totaling 11.76 million. Driving that decline were 79.9K and 66.08K declines in regular state and PEUC programs. The biggest decline came from the extended benefits program, though. That program saw claims get more than cut in half after a significant uptick the previous week. Throughout the month of July, claim counts for the extended benefits program were particularly volatile. They started off the month with a sub-100K reading of 98.4K, then rose all the way up to 343.5K, dropped to 239.6K, then rose again to 398.8K before falling back down to 177.9K in the week of July 30th. Click here to view Bespoke’s premium membership options.


Bespoke’s Morning Lineup – 8/19/21
See what’s driving market performance around the world in today’s Morning Lineup. Bespoke’s Morning Lineup is the best way to start your trading day. Read it now by starting a two-week trial to Bespoke Premium. CLICK HERE to learn more and start your trial.
“A trader, in addition to studying basic conditions, remembering market precedents and keeping in mind the psychology of the outside public as well as the limitations of his brokers, must also know himself and provide against his own weaknesses.” – Edwin Lefèvre, Reminiscences of a Stock Operator
US equity futures are currently down pretty significantly (-0.80%) after major indices fell more than 1% yesterday. The declines are being led by the Energy sector, which has already fallen more than 6% over the last week.
Read today’s Morning Lineup for a recap of all the major market news and events from around the world, including the latest US and international COVID trends.
Also, make sure to check out our Daily Sector Snapshot.

Breadth had made a bit of a turnaround earlier this month, but the last week has been brutal with investors really selling the cyclical sectors that are dependent on a strong economy. While the cap-weighted S&P 500 is less than 2% from all-time highs, the average stock in the S&P 1500 index (made up of large-caps, mid-caps, and small-caps) is 15.8% from its 52-week high. As shown below, the average Energy stock in the S&P 1500 is more than 30% from its 52-week high, while Communication Services stocks are down an average of 21.4% from their highs. The defensive Utilities sector has held up the best with the average stock just 6.1% from its 52-week high.

It’s been a choppy summer for stocks even though things look positive at the index level. As shown below, over the last three months, the cap-weighted S&P 1500 is up 5.9%, but the average stock in the index is actually down 0.65% over the same time frame.

Want to see more charts and analysis ahead of today’s open? Start a two-week trial to Bespoke Premium and read today’s full Morning Lineup.
Daily Sector Snapshot — 8/18/21
Bespoke Baskets Update — August 2021
Chart of the Day – Small Range for Small Caps
Bespoke’s Morning Lineup – 8/18/21
See what’s driving market performance around the world in today’s Morning Lineup. Bespoke’s Morning Lineup is the best way to start your trading day. Read it now by starting a two-week trial to Bespoke Premium. CLICK HERE to learn more and start your trial.
“There is only one boss. The customer. And he can fire everybody in the company from the chairman on down, simply by spending his money somewhere else.” – Sam Walton
US equity futures are trading down slightly ahead of the open after major indices finished yesterday solidly in the red.
Read today’s Morning Lineup for a recap of all the major market news and events from around the world, including the latest US and international COVID trends.
Also, make sure to check out our Daily Sector Snapshot.
Home Depot (HD) finished down 4.27% yesterday following its Q2 earnings report. As shown below, the move lower left the stock just a hair below its 50-day moving average. For now, a double top looks to be in place for HD, so the technicals will not turn positive again until new highs are made.

Home improvement competitor Lowe’s (LOW) actually fell more than Home Depot (HD) in reaction to HD’s weakness yesterday. LOW finished yesterday down 5.8%, pushing its share price below prior lows made in mid-June.

Investors who sold LOW yesterday on the weakness for HD are kicking themselves this morning, because LOW just reported its own earnings triple play by beating EPS estimates, beating sales estimates, and raising guidance. Pre-market, LOW shares are trading up 4%.
Want to see more charts and analysis ahead of today’s open? This morning we’re covering earnings reports from Target (TGT) and Lowe’s (LOW) and the recent negative action in restaurant stocks as COVID cases rise across the country. Start a two-week trial to Bespoke Premium and read today’s full Morning Lineup.