B.I.G. Tips – Q3 Earnings Season on Deck
Crude and Natural Gas Break Out
In an earlier post, we noted the long-term breakout of cotton futures in the context of what has been a historic short-term run. Elsewhere in the commodities space, there are other breakouts occurring today. As shown in the first chart below, crude oil took out its July intraday high of $76.98 yesterday and it has continued to move above those levels today. While crude oil is now within one dollar of $80, natural gas is also hitting a new high as the commodity continues to surge on supply concerns as we discussed in today’s Morning Lineup.

As both commodities rapidly trend higher, comparing the two, natural gas comes out as the clear winner recently. In the chart below we show the ratio of front-month crude oil futures to natural gas futures. When the line is rising, oil is outperforming natural gas. When the line is falling (as it is now), natural gas is outperforming oil. Since this past March, the ratio of the two has been in a steady decline and it is now at the lowest levels in a little under one year. Prior to that, the only lower readings in the ratio of the past five years was when crude prices went negative in April 2020 and in November 2018. Click here to view Bespoke’s premium membership options.

Performance Through Q3 And its Impact on Q4 Performance
Every year, the makeup and number of sectors that outperform the S&P 500 changes. This year, four sectors (Energy, Financials, Real Estate, and Communication Services) outperformed the S&P 500 through the end of Q3, while last year it was only three sectors that outperformed in the first three quarters of the year (Technology, Consumer Discretionary, and Communication Services).
As we all know, past performance does not indicate future performance, and in looking at sectors that have outperformed the S&P 500 in the first three quarters of prior years compared to how they performed in Q4, the same holds true. The table below lists the number of sectors that outperformed and underperformed the S&P 500 in the first three quarters of each year since 2000 and then shows their median performance during Q4 of the same year. Looking at a summary of the annual results, it’s almost a coinflip as to whether or not the leading sectors in the first three quarters of a given year will continue to outperform in Q4. On average, the sectors that outperform YTD through 9/30 have averaged a Q4 gain of 3.58% (median: +6.40%) with positive returns 76% of the time. Sectors that lag the S&P 500 in the first three quarters of the year average a rest of year gain of 3.67% (median: 5.95%) with gains 71% of the time. While the term ‘strength begets strength’ has historically been applicable to the broader market, at the sector level, buying the YTD winners (or losers) ahead of Q4 in expectation of continued momentum to close out the year (or a mean reversion bounce) hasn’t offered any material outperformance. Click here to view Bespoke’s premium membership options.

Bespoke Stock Scores — 10/5/21
Bespoke’s Consumer Pulse Report – October 2021
Cotton Catches Fire
There is another commodity that can now be added to the list of assets that have experienced wild swings this year. Reminiscent of lumber earlier this year or natural gas more recently, in the agriculture space, cotton has experienced an explosive move to the upside. As shown below, front-month futures were already seeing a solid move higher since last year’s lows. But in the 12 trading days since the recent low on September 20th, cotton has surged over 20%. As of this writing, that leaves the commodity at the highest level in a little over a decade as it has broken out above the May 2014 and June 2016 highs.
Going back since 1990, there are not many examples of cotton rallying over 20% in the span of only 12 sessions; especially in more recent history. As shown in the second chart below, this is the first +20% rally in 12 days since June 2012 when cotton rose 28.38%. Going back over the decade leading up to that occurrence, there were a handful of other rallies of the same size if not larger.

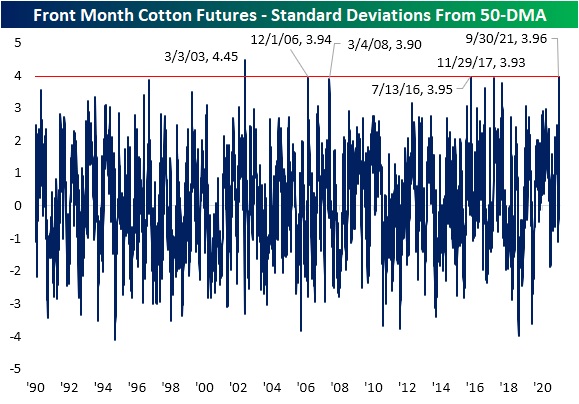
Given the rapid rise in cotton prices, the commodity is now very extended relative to its 50-DMA. In fact, there has only been one time since 1990, March 2003, when cotton was as extended above its 50-DMA as measured in standard deviations. With that said, there were some instances in which the overbought reading was at least similar though. For example, November 2017, July 2016, March 2008, and December 2006 also saw cotton move to over 3.9 standard deviations above its 50-DMA as is the case today.
Given the surge in prices, speculator positioning around the commodity is overwhelmingly long. Data from the CFTC’s Commitment of Traders report—which we also reviewed with regards to other assets in last night’s Closer—shows the percent of open interest for cotton futures is currently 40.97% net long. That is the highest and first reading above 40% since the week of July 2018. It also ranks in the top 2% of all readings on record going back to 1986. In other words, speculators broadly have held a positive outlook on cotton and they have been proven correct.

As for agricultural commodities more broadly, cotton has not necessarily boosted the aggregate space. The Invesco DB Agriculture Fund (DBA) which tracks 10 agricultural commodities including cotton has remained in consolidation over the past several months with a failed attempt to break out of that range only a couple of days ago. As for why the surge in cotton has not also led to a surge in DBA is that the commodity has a relatively low weighting accounting for just over 3% of net assets tying it with Feeder Cattle for the smallest weighted future of the ten tracked by the fund. Click here to view Bespoke’s premium membership options.
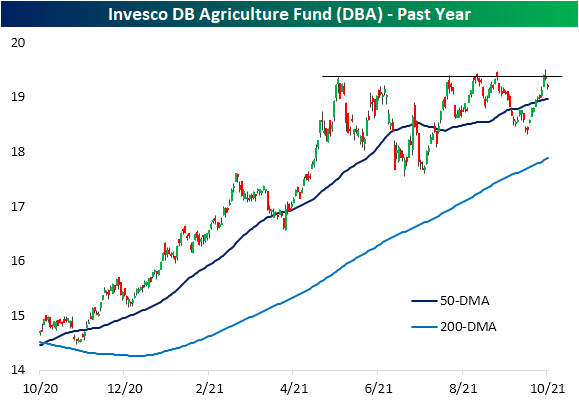
Chart of the Day: Friday Gains, Monday Drops
Bespoke’s Morning Lineup – 10/5/21 – Trying Again
See what’s driving market performance around the world in today’s Morning Lineup. Bespoke’s Morning Lineup is the best way to start your trading day. Read it now by starting a two-week trial to Bespoke Premium. CLICK HERE to learn more and start your trial.
“Be willing to make decisions. That’s the most important quality in a good leader. Don’t fall victim to what I call the Ready- Aim-Aim-Aim Syndrome. You must be willing to fire” – T. Boone Pickens
After a sell-off in Asia overnight that took the Nikkei down over 2%, European equities have been bouncing back this morning with gains of between 0.50% and 1.0% across the region. US equity futures are also trading higher and have been building on their gains throughout the morning. Besides the fact that it’s Tuesday and we had a big sell-off yesterday, there’s really not much driving the action this morning. We’ve had a number of these situations in the last few weeks where futures were positive only to give up those gains throughout the day, so we’ll see if the bulls can keep the market in the green today.
Pepsi (PEP) reported earnings earlier and topped both top and bottom-line forecasts. In economic news, the only report on the calendar is ISM Services at 10 AM. Economists are forecasting the headline reading to show a modest decline relative to August’s reading.
Read today’s Morning Lineup for a recap of all the major market news and events from around the world, including the latest US and international COVID trends.
While the rest of the market has been under pressure, energy stocks have been on fire. Just in the last ten trading days, the S&P 500 is down over 1%, but the Energy sector is up over 15%! Going back to 1990, there has never been another 10-trading day period where the S&P 500 was lower and the Energy sector was up over 15%. The only period that was even close was earlier this year in March when the S&P 500 was down 1.7% and the Energy sector was up 14.9%.
One reason we’ve never seen such a wide divergence between the S&P 500 and the Energy sector is that historically, the sector was always a larger share of the S&P 500, so when it rallied as much as it has now, it had a larger impact on the index. Now that it is such a small share of the overall index, though, it can have a move of the magnitude it has had over the last two weeks and still have a negligible impact on the broader market.

Start a two-week trial to Bespoke Premium and read today’s full Morning Lineup.
Daily Sector Snapshot — 10/4/21
200-DMA Breakdown for FANG+
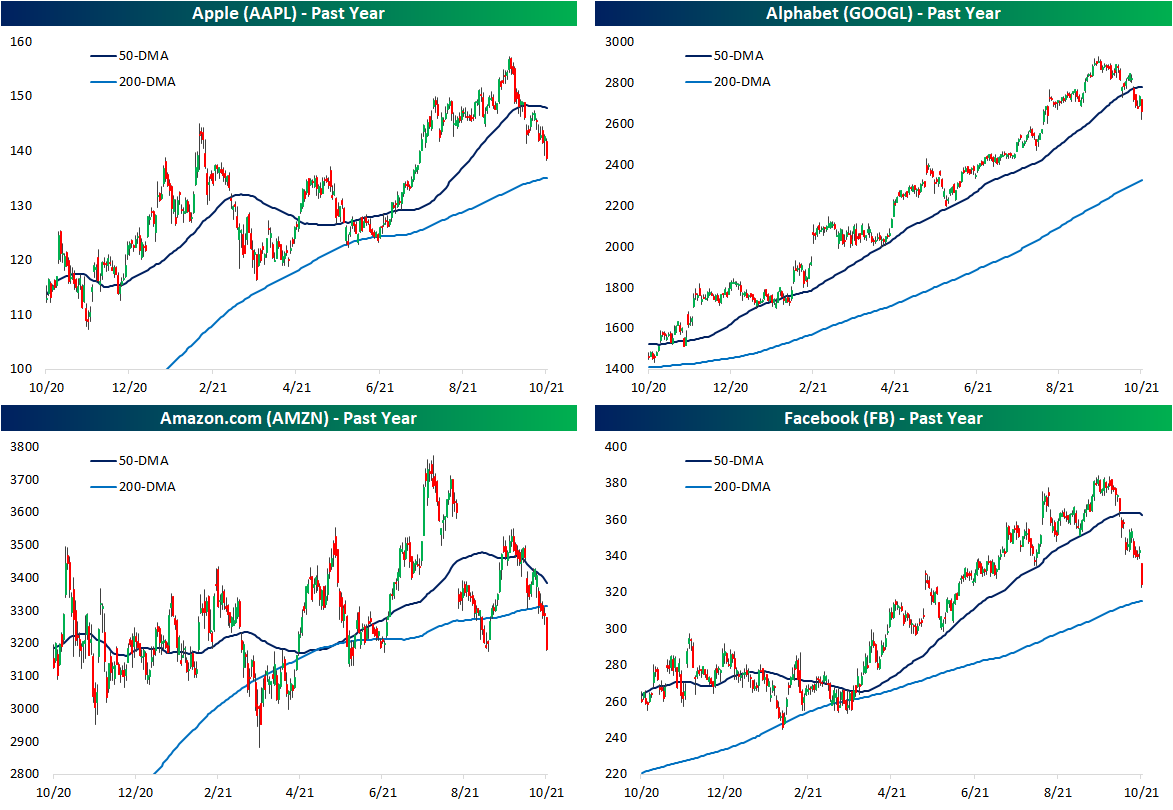
Mega cap tech tracked by the NYSE FANG+ index is getting crushed today and is down 3.2% for its worst single-session since May 10th when it fell 3.6%. One key difference between today and then is the technical damage done from a charting perspective. Today’s drop brings the FANG group below its August 19th low and more importantly below its 200-DMA. That marks the first close below its 200-DMA in 378 trading days. While the index does not have the most extensive history dating back to only to 2014, that makes for the second-longest such streak on record behind one that lasted 573 days ending almost exactly three years ago to the day.

Panning over the largest of the FANG stocks by market cap, most are still above their own 200-DMAs with the exception of Amazon (AMZN). Like the index, each of these names have been breaking down a bit from a technicals standpoint. In the case of Facebook (FB) and Alphabet (GOOGL), long-term uptrends are now broken. In tonight’s Closer, we illustrate the impact that the decline of these stocks have had on the S&P 500. You can read more about the FANG breakdown and more in tonight’s Closer with a two-week Bespoke Institutional trial.