Bespoke’s Morning Lineup – 11/18/21 – Philly Fed Jumps
See what’s driving market performance around the world in today’s Morning Lineup. Bespoke’s Morning Lineup is the best way to start your trading day. Read it now by starting a two-week trial to Bespoke Premium. CLICK HERE to learn more and start your trial.
“Trying to sell short in this market is like being run over by a train that’s going to derail a mile down the road.” – Julian Robertson
We may be at the tail end of earnings season, but it’s not going out quietly as we’re seeing some significant earnings-related moves this morning. On the downside, both Cisco (CSCO) and Alibaba (BABA) are down over 6% as they both missed sales estimates and lowered guidance. On the upside, even after the run it has had into earnings, Nvidia (NVDA) is up over 8%. In the retail space, a number of stocks including Victoria’s Secret (VSCO), Kohl’s (KSS), and Macy’s (M) are all up by at least 7%.
Today is also a fairly busy one for economic data as well with Jobless Claims and the Philly Fed at 8:30 and then Leading Indicators at 10 AM. Then, at 11 AM we’ll close out the week’s economic calendar (there are no reports scheduled for tomorrow) with the KC Fed r manufacturing report. Jobless Claims were pretty much right inline with expectations coming in at a post-COVID low of 268K while continuing claims were much lower than expected at 2.08 million. The Philly Fed report also came in better than expected coming in at a level of 39.0 which was the best reading since April.
Read today’s Morning Lineup for a recap of all the major market news and events from around the world, including the latest US and international COVID trends.
Relative to last Wednesday’s close, major US equity averages have generally had a positive bias but have seen little in the way of moves in either direction. As shown in our Trend Analyzer snapshot of US index ETFs, the only one that has moved up or down 1% during this period is the Micro-Cap index (IWC) with a decline of 1.17%. Despite the decline, though, IWC remains at overbought levels and is still one of the top-performing ETFs YTD. Behind IWC, the next worst performing index ETF in our snapshot is IWM which is down 0.9% over the last week. Like IWC and every other index ETF listed below, IWM remains at overbought levels, so it’s not as though these moves have been significant.

With small caps and large caps at two different ends of the performance spectrum this week, we wanted to highlight each index’s price chart to show how the moves look from a longer-term perspective. IWM has seen a pretty swift reversal in the last week, but it also follows a short-term move that was much steeper to the upside. Large caps like SPY, on the other hand, saw more gradual (relatively) increases leading up to their recent highs and remain right near all-time highs with the S&P 500 actually coming up just short of a record closing high on Tuesday.

Start a two-week trial to Bespoke Premium to read today’s full Morning Lineup.
Daily Sector Snapshot — 11/17/21
Bespoke Baskets Update — November 2021
EV Market Caps Disregarding Sales
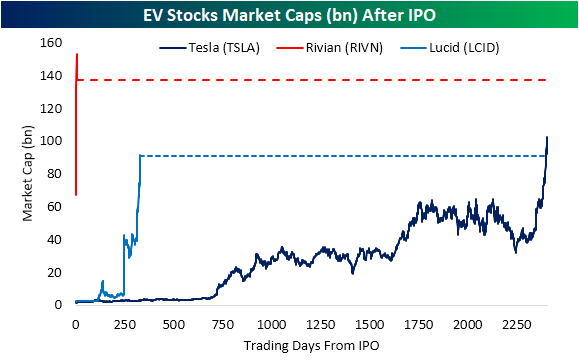
The newest EV IPO — Rivian (RIVN) — was down 15% today, but it still has a market cap of $125 billion, and it took only three trading days for the stock to close with a market cap of more than $100 billion.
Remember in the mid-2010s when Tesla (TSLA) bears complained about the company’s multi-billion dollar market cap even though it hardly had any revenues? Well, the action in the EV space lately makes those prior Tesla complaints look laughable.
With Rivian (RIVN) now worth over $100 billion after just a few trading days and Tesla competitor Lucid (LCID) worth more than $80 billion, we wanted to highlight how long it took Tesla (TSLA) to trade at a similar market cap. As shown below, it wasn’t until January 13, 2020 that TSLA’s market cap first crossed above Lucid’s current market cap, and TSLA didn’t cross above Rivian’s (RIVN) market cap until February 2nd, 2020. While it took Tesla 2,407 trading days from its IPO to hit $100 billion in market cap, it only took three trading days for RIVN to do the same.
When Tesla first reached $100 billion in market cap in January 2020, the company had reported revenues of $7.4 billion in the most recent quarter. RIVN and LCID, on the other hand, are still considered “pre-revenue” companies!

The rise of the electric vehicle is an overarching trend that consistently finds its way into the headlines. As shown below, Google Trends scores for terms like “Electric Car” and “EV” are approaching record highs and have more generally been grinding higher over the past few years with particular acceleration in 2020 and beyond.

The past couple of months has seen plenty of EV stock headlines ranging from the surge in Tesla (TSLA) as it eclipsed a $1 trillion market cap and the strong IPO of Rivian (RIVN). As a result of the strong performance of these stocks, looking at the largest global automobile manufacturers by market cap, EV names now have a significant presence. In fact, of a universe of 118 global auto stocks with market caps of at least $100 million (USD adjusted), 42% of the combined market cap is made up of four EV names—Tesla (TSLA), NIO (NIO), Lucid (LICD), and Rivian (RIVN). TSLA is of course the bulk of this with nearly a third of that total share, but Rivian (RIVN) is also high up on the list ranking as the third-largest of any single auto stock, and that is only after trading for a few days!

With that said, those valuations are pretty extreme when compared to sales (again USD adjusted). In the chart below, we show the same stocks but as their share of the group’s trailing 12-month revenues. As shown, the most legacy company of the EVs, TSLA, only made up for 1.9% of the industry’s revenues. NIO is the only other one with any sales to speak of.
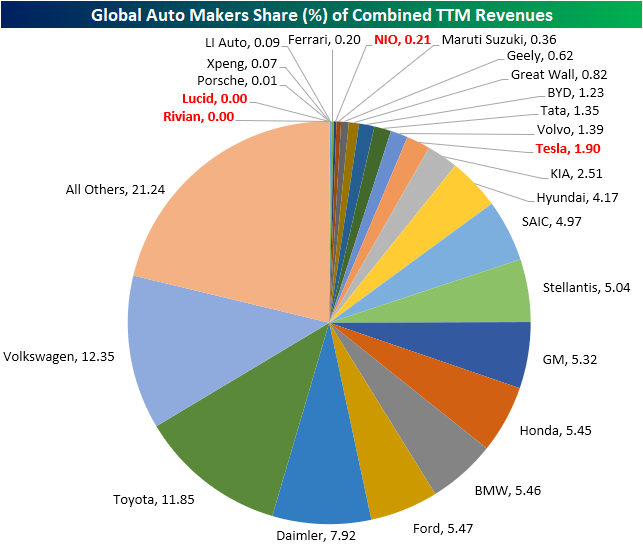
Obviously, there is a major disconnect between these stocks’ sales figures over the past year and their market caps. Traditional automakers are bringing in far higher revenues than EV’s which for whatever reasons (rational or not) are not being reflected in market caps. Click here to view Bespoke’s premium membership options.

Chart of the Day – Earnings Season Gets the Bronze!
Stocks Most Impacted by 7-10 Year Treasuries
Since the beginning of the pandemic, investors have consistently discussed the relationship between treasury yields and the performance of equities. Of course, every company is different, and there are some companies that benefit from higher Treasury yields while others outperform when rates decline.
The table below summarizes the S&P 500 members that perform best when the iShares 7-10 Year Treasury Bonds ETF (IEF) loses value. We measure this by calculating the correlation coefficient of individual stock prices against the price of IEF since the start of 2020. In other words, when rates increase (IEF price declines), these stocks experience positive price movement. M&T Bank (MTB), American Airlines (AAL), and Hewlett Packard (HPE) top this list, and all the names on this list have high correlation coefficients implying that they are closely tied to the performance of IEF on an inverse basis. Other notable names on this list include Ralph Lauren (RL), Citigroup (C), Fox Corp (FOX), and Tyson Foods (TSN). Of the 20 companies on this list, six come out of the Industrials sector and 5 are from the Financials sector. The average YTD performance of the names on this list through 11/15 was a gain of 31.1% (median: +25.2%).

To help you visualize exactly what we are looking at, take a look at the chart below. MTB is the stock most inversely correlated to IEF. Since 2020, it has routinely moved in the opposite direction as IEF. When IEF moves up, MTB tends to decline, and vice-versa. If you believe that treasury yields will rise, MTB and the other names on the list are ones that have historically benefitted in that environment.

The next table shows the S&P 500 stocks that have benefitted during periods of falling yields, which would be represented by an upward move in the price of IEF. The stocks on this list are generally less correlated to the movements of IEF, so the correlation coefficients are less statistically significant. The average returns for the stocks on this list on a YTD basis is a decline of 1.9% (median: -2.1%) through 11/15. Clorox (CLX), Vertex (VRTX), and Incyte (INCY) have the highest correlation coefficients to IEF, and other notable names include Regeneron (REGN), MarketAxess (MKTX), and General Mills (GIS). 7 of the 20 companies on this list are from the Consumer Staples sector, 4 are in the Health Care sector, and 3 are in the Real Estate sector.

As you can see, the price movements between CLX and IEF have been quite similar since the start of 2020. While prices of CLX and IEF have been well correlated since the start of 2020, we would note that outside of the first five stocks on the list, none of the other names listed have a correlation coefficient of more than 0.5 indicating that the relationships are not nearly as strong as the names on the first list above. In terms of both lists, the correlation coefficients are simply telling us how each stock has traded with respect to IEF since the start of 2020, but whether those relationships hold up going forward is uncertain, Click here to view Bespoke’s premium membership options.

Bespoke’s Morning Lineup – 11/17/21 – Soft Housing Data
See what’s driving market performance around the world in today’s Morning Lineup. Bespoke’s Morning Lineup is the best way to start your trading day. Read it now by starting a two-week trial to Bespoke Premium. CLICK HERE to learn more and start your trial.
“Trying to sell short in this market is like being run over by a train that’s going to derail a mile down the road.” – Julian Robertson
Futures have been weakening as we write this and are now pointing to a negative open ahead of some important housing data at 8:30 AM. Housing Starts came in at 1.52 million annualized which was weaker than expected and the second straight month that the headline reading missed expectations. Building Permits also missed forecasts for the second straight month coming in at a level of 1.630 million versus forecasts for a rate of 1.644 million.
In earnings news, both Lowes (LOW) and Target (TGT) reported earnings this morning, and while both reports were better than expected, concerns over margins at TGT have that stock trading down over 3%.
Read today’s Morning Lineup for a recap of all the major market news and events from around the world, including the latest US and international COVID trends.
Ahead of today’s reports on Building Permits and Housing Starts for October, yesterday’s release of homebuilder sentiment for November came in significantly stronger than expected suggesting that the recent uptick in interest rates hasn’t deterred potential homebuyers. Rising rates also haven’t had a negative impact on homebuilder stocks recently either. In yesterday’s trading, the iShares Home Construction ETF (ITB) didn’t quite trade at a new intraday high, but it did manage to hit a new high on a closing basis. Meanwhile, the S&P Homebuilders ETF (XHB) not only hit a new intraday higher yesterday, but it has been trading at new highs on a pretty regular basis in recent days. Unlike ITB, which is more of a pure-play on homebuilders, XHB has more exposure to companies like Home Depot (HD) and Lowes (LOW) that supply homebuilders as well.

Start a two-week trial to Bespoke Premium to read today’s full Morning Lineup.