Sovereigns Soar
All around the world, government bond yields are on the rise and hitting some significant levels. In many cases, the rapid increase in yields over the past month has resulted in multi-month, if not multi-year, highs. For Spain and Italy, today’s level of yields are the highest since May and June 2020, respectively. The 10 year US Treasury yield has reached the highest level since January 2020 as Canada, France, the UK, and Germany meanwhile have the highest yields since the spring of 2019. In the case of Germany, the bund yield even moved back into positive territory for the first time since 2019. As the 10-year yield on Swiss bonds has reached the highest level since the fall of 2018, it too has moved back into positive territory in recent weeks. While it has also seen a big rise in yields, Brazilian bond yields remain further off of prior highs.
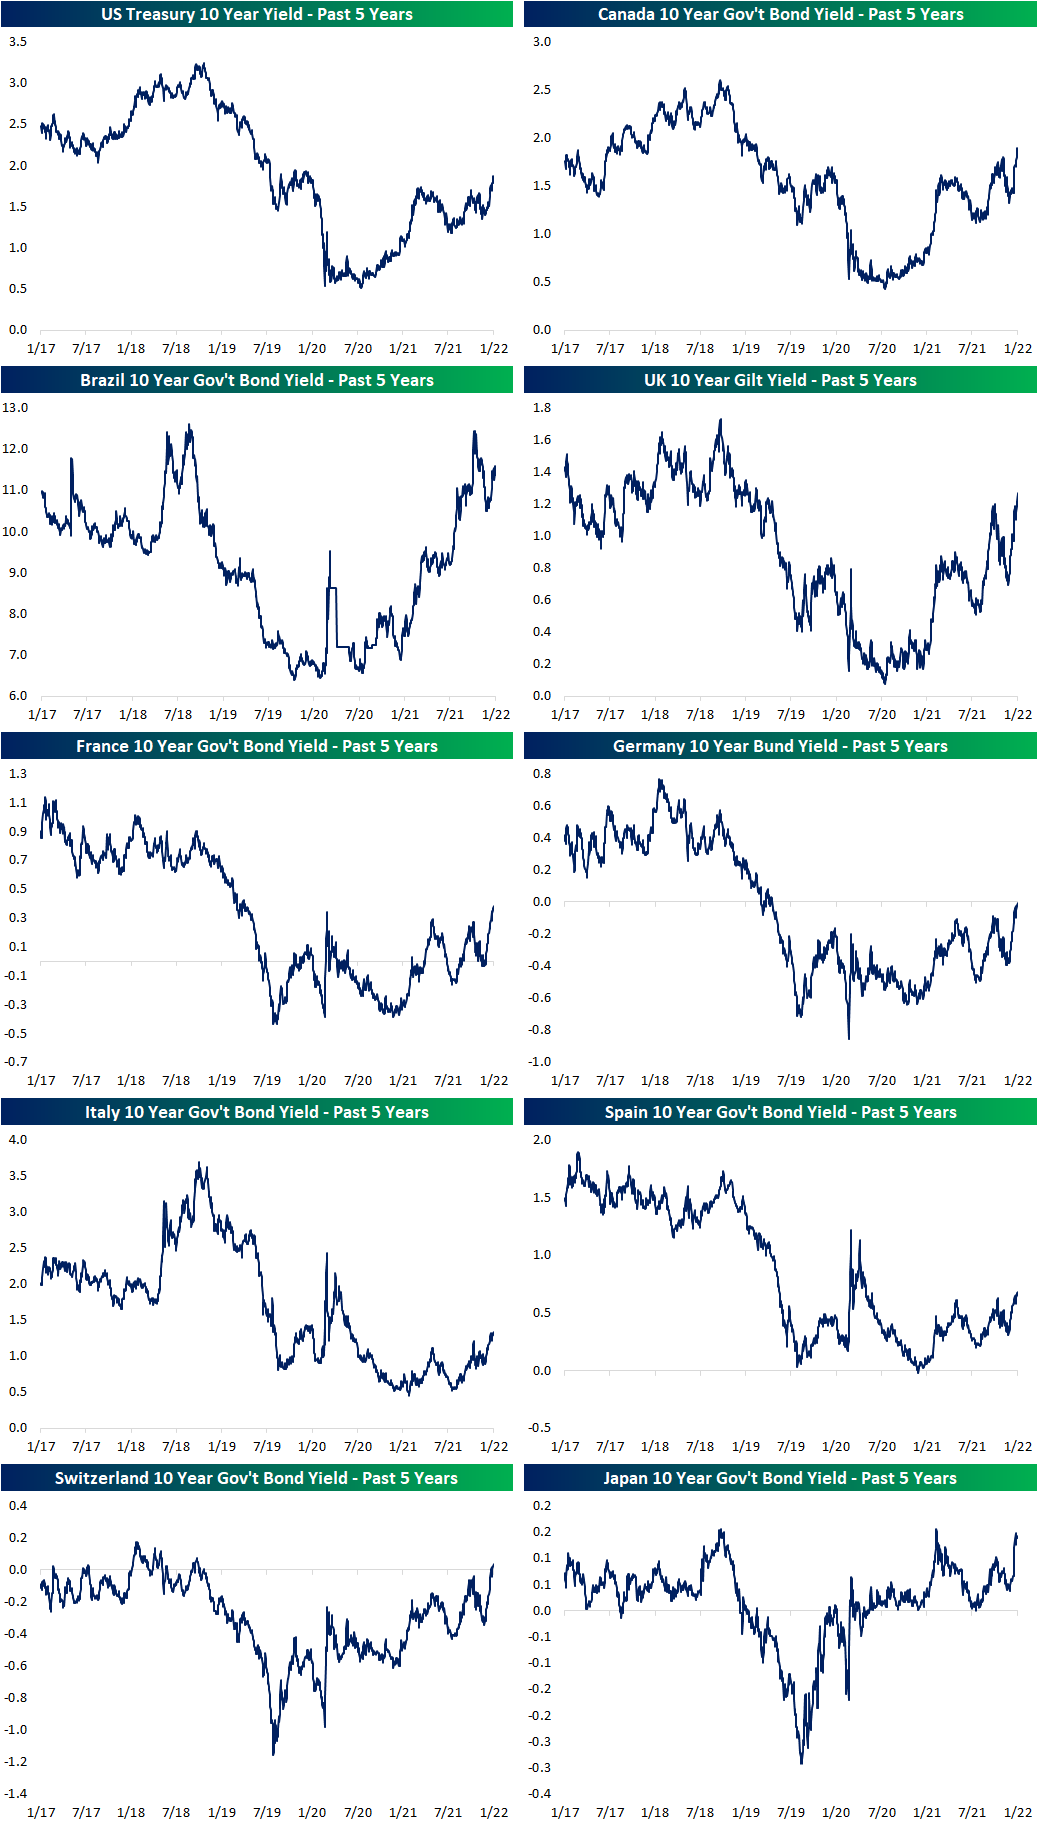
As previously mentioned, the broad move in yields in the past month has been rapid. In the charts below, we show the one-month change in the 10-year yields for these countries’ bonds going back over the past five years. In most cases, the current run has been the sharpest increase since around the time of the COVID crash. For each country shown, those one-month changes also rank in the top few percent of all monthly changes over the past two decades. In fact, for Canadian bonds and UK Gilts, the moves rank in the top 1% of all monthly moves over the past twenty years. In today’s Fixed Income Weekly, we take a closer look at the moves in yields for a range of countries, and the implications for foreign exchange. Click here to view Bespoke’s premium membership options.

B.I.G. Tips – Small Cap Death Cross
Bespoke’s Morning Lineup – 1/19/22 – Strong Housing Data
See what’s driving market performance around the world in today’s Morning Lineup. Bespoke’s Morning Lineup is the best way to start your trading day. Read it now by starting a two-week trial to Bespoke Premium. CLICK HERE to learn more and start your trial.
“A good first impression can work wonders.” – J.K. Rowling
Futures are attempting a bounce after yesterday’s wallop, and positive reactions to earnings from Bank of America (BAC) and Morgan Stanley are contributing to the positive tone. The only economic reports for the morning were Housing Starts and Building Permits, and both came in significantly higher than expected and at their second-highest levels since the financial crisis. The only readings that were strong for each series were in Q1 of 2021.
Read today’s Morning Lineup for a recap of all the major market news and events from around the world, including the latest US and international COVID trends.
First impressions are always important, but they’re not always accurate, and that’s the hope of bulls following the first days of earnings season. Banks kicked off the Q4 earnings season late last week, and two of the largest to report were Goldman Sachs (GS) and JP Morgan Chase (JPM). The stocks of both banks had abysmal reactions to their reports.
Following Friday’s report from JPM, the stock declined 6.15% which ranks as the worst earnings reaction day performance for the stock in at least 20 years beating out the 6.06% decline the stock experienced in January 2009 during the thick of the financial crisis. The reaction in GS to its earnings report on Tuesday wasn’t much better with the stock falling just under 7%. That was large enough to rank as the second-worst earnings day reaction for the stock behind only the 11.56% decline in April 2009 just as markets were coming out of the financial crisis.
As disheartening as a bad first impression can be, one potential bright side is that it can have the effect of resetting the bar low, and in early trading, both Bank of America (BAC) and Morgan Stanley (MS) are trading up close to 3% in reaction to their reports. Whether those gains can hold through the opening and closing bell, though, is another story.


Start a two-week trial to Bespoke Premium to read today’s full Morning Lineup.
Chart of the Day – Mid-Term Election Years
Bespoke Stock Scores — 1/18/22
Daily Sector Snapshot — 1/18/22
Energy Exploding (Relatively Speaking)
To help get a gauge on which sectors are out- or underperforming the broader market, in the charts below, we show the relative strength lines of each of the eleven sectors versus the S&P 500 over the past year from our Sector Snapshot. Market trends in the prior days and weeks have resulted in some notable moves across these relative strength lines.
With Consumer Discretionary one of the weaker sectors of late as high growth areas have gotten hit hardest, its relative strength line has broken below its most recent low. While Consumer Discretionary has broken down on a relative basis, Communication Services, which has seen a massive string of underperformance since the summer, has seen a modest reversal higher, although the steep downtrend of the relative strength line is still in place.
The Tech sector has also seen a breakdown in its relative strength line recently with a collapse in the past month. Conversely, Real Estate has held onto its uptrend with its relative strength line bouncing over the past couple of days.
Consumer Staples, Financials, and Industrials, meanwhile, have been in downtrends over most of the past year. The recent strength of Staples and Industrials have broken those downtrends materially while Financials have failed to break out in the past several days after a big leg higher in the preceding weeks. Utilities similarly has failed to move out of its downtrend. At that same time, Energy has essentially made a vertical move higher after what was generally a sideways move in the past year.

The last couple of years has certainly seen a strong run for the Energy sector, but taking a longer-term look at performance relative to the broader market it is hard to tell. In the chart below, we show the relative strength line of the Energy sector versus the S&P 500 starting on 7/1/08, when the ratio of the sector to the S&P 500 hit its all-time high. As shown, there has been secular underperformance from Energy stocks since the Global Financial Crisis which hit its most extreme level during the COVID crash. Since the lows in the spring of 2020, the Energy sector has rebounded, and the relative strength line is at some of the highest levels in the past couple of years, but there is still a long way to go in order to break the longer-term downtrend. Stay on top of market trends by becoming a Bespoke subscriber today. Click here to view Bespoke’s premium membership options.

Chart of the Day: NASDAQ Composite Breaks Below Its 200-DMA
Decimated Demand Drops Empire Fed
The new year’s first regional manufacturing reading came out of New York this morning. Covering the month of January, today’s Empire Manufacturing report was outright bad at the headline level. While the December reading was at the high end of the post-pandemic and historic range (in the 95th percentile of all months), the January reading was far weaker falling into the bottom quartile of historic readings. At -0.7, it was the first contractionary reading for Empire Manufacturing in eighteen months (since June 2020). That 32.6 point drop was also the third-largest month-over-month decline on record behind March and April 2020.

Looking under the hood of the report, the massive drop in general business conditions is to a certain extent misleading and there is nuance to the various categories. Breadth was in fact bad indicating a broad deceleration in activity across categories, but the massive drop in general business conditions was largely due to a massive slowdown in demand. Like the headline number, both the indices for New Orders and Shipments fell dramatically. Alongside General Business Conditions, only New Orders saw a contractionary reading on that move. Again, other areas of the report did not help the headline index with only Inventories rising month over month. That being said, current levels remain far more elevated for those other categories with many in the upper decile of their historical ranges.

The decline in New Orders points to demand falling for the first time since August 2020. As a result, Unfilled Orders also fell significantly as Inventories rose, but the readings remain much healthier in the 93rd and 95th percentiles, respectively. In other words, even though there wasn’t the same massive inflow of orders as we’ve seen over the past year and a half, there is still plenty of demand left to be fulfilled. Unfortunately, Shipments decelerated sharply and only increased slightly which could be a result of higher COVID case counts holding back production/fulfillment.

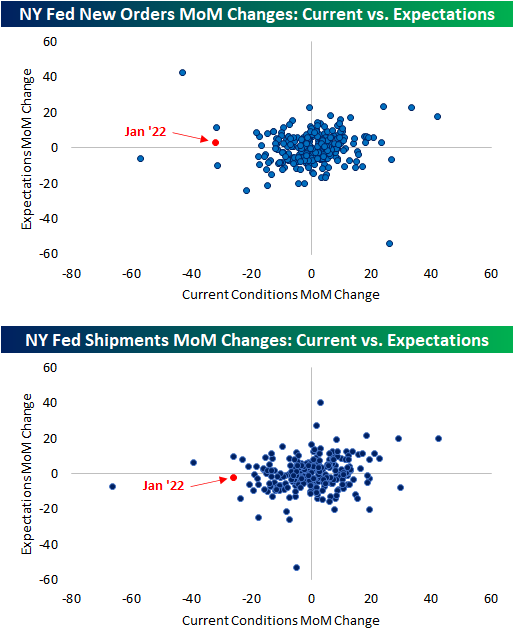
One interesting aspect to note for demand and shipments (and this also applies to the headline index) is the huge disconnect between the moves in current conditions and expectations. Expectations indices remain far healthier in comparison to current condition indices, and the drops, if any, were much more modest this month. In fact, in the charts below showing the month-over-month changes of all months on record between the two series, January was certainly an outlier month. A heavy burden from absentees as a result of COVID could be extrapolated as a reason for this disconnect. In other words, New York area firms were hit hard by COVID in January but they do not expect the current wave’s impact to last out through six months.
Even though New York area manufacturers were not seeing growth in the pace of getting products out the door as in past months, working in their favor has been a significant improvement in supply chains. Delivery times remain well above any period prior to the pandemic, but the index fell for the third month in a row.

Another more welcome sign of the report was that Prices Paid and Prices Received have both peaked. The drop in Prices Received was more significant of the two. On the downside, expectations have continued to rise unabated with each index hitting a record high.

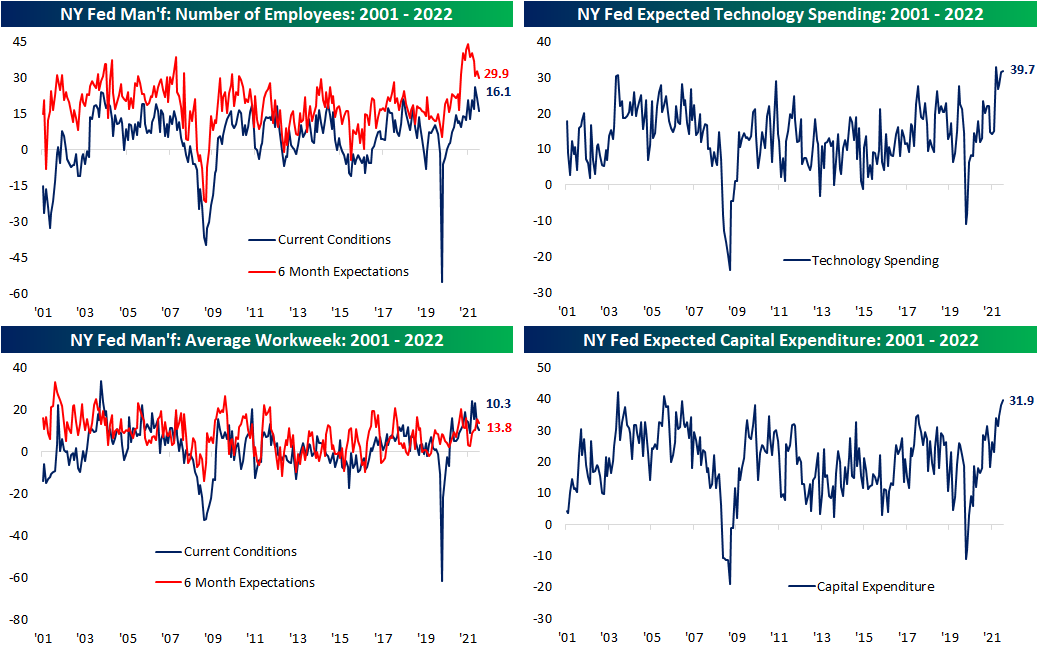
Hiring pulled back in January as did Average Workweek with the weakest readings since last August. Expectations for Number of Employees hit its lowest level since last February. Meanwhile, manufacturers plans for spending on Tech and Cap. Ex. is far more optimistic with January readings in the top 1% of all months on record. Click here to view Bespoke’s premium membership options.
Bespoke’s Morning Lineup – 1/18/22 – At Least It’s Tuesday
See what’s driving market performance around the world in today’s Morning Lineup. Bespoke’s Morning Lineup is the best way to start your trading day. Read it now by starting a two-week trial to Bespoke Premium. CLICK HERE to learn more and start your trial.
“A pessimist sees the difficulty in every opportunity; an optimist sees the opportunity in every difficulty.” – Winston Churchill
Despite an extra day off, the equity market is not looking like it’s going to get off to a good start to the trading week with futures on the major averages all lower. After outperforming the S&P 500 last week, the Nasdaq is leading the charge lower this morning with a decline of over 1%. The culprit this morning, as it seems to be every day, is interest rates as the yield on the 10-year tops 1.8% and the 2-year yield moved back over 1%.
On the earnings front, reports so far this morning have been mixed, but the most high-profile report so far has been Goldman (GS) which actually missed EPS forecasts and is trading down over 5%. It’s not looking like a positive start to the shortened week, but at least it’s Tuesday already.
Lastly, in just announced news, Microsoft (MSFT) is planning to acquire Activision Blizzard (ATVI) for $95 per share in cash. On the economic side, the Empire Manufacturing report for January came in much weaker than expected falling to -0.70 versus December’s reading of 31.9. That was the largest m/m decline since the early days of the pandemic in April 2020. This report comes on the same day the markets are now pricing in a 100% chance of a 25 bps rate hike in March and even a slight chance for 50 bps!
Read today’s Morning Lineup for a recap of all the major market news and events from around the world, including the latest US and international COVID trends.
The Nasdaq 100 tracking ETF (QQQ) is set to open down over 1% this morning which would be the fourth downside gap of at least 1% over the last 50 trading days. The way the Nasdaq has been trading lately, we were actually surprised that the number of downside gaps wasn’t higher. In any event, the rolling number of downside 1%+ gaps for QQQ is now at the highest levels since last July, but still just a fraction of the pace we saw during the COVID crash. Over the last five years, there have been 77 prior downside gaps of 1%, and on those days, the median change from the open to close for QQQ has been a gain of 0.30% with positive returns 57% of the time. However, when those downside gaps occurred on the first trading day of the week (Monday or Tuesday), the median change from the open to close was actually a decline of 0.08% with gains just half of the time.

Start a two-week trial to Bespoke Premium to read today’s full Morning Lineup.