Daily Sector Snapshot — 2/2/22
B.I.G. Tips – Will Splits Splatter?
Chart of the Day – February Intra-Month Seasonality
Performance During Winter Olympics
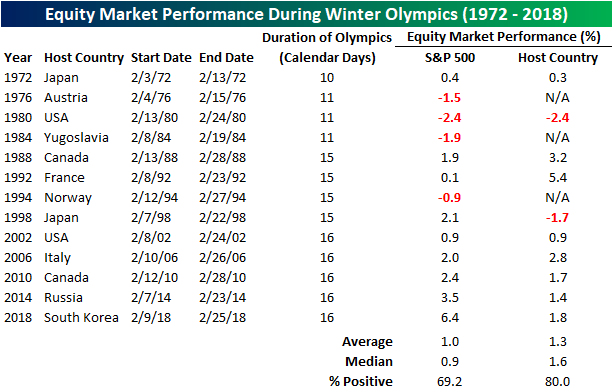
Are you ready for the Olympics? The 2022 Winter Olympics will kick off this Friday, and with that, we wanted to provide an update on how equities typically perform during the winter games. In the table below, we list the start and end dates of every Winter Olympics since 1972 and show the performance of the S&P 500 and the host country’s benchmark stock index during each one. For the S&P 500, performance has tended to be positive with an average gain of 1.0% (median: 0.9%) and positive returns just under 70% of the time. Compared to all two-week periods over that same period (average: +0.4%, median: +0.6%), these returns are better than average.
For the host country, stock market performance has also been strong. Since 1972, the host country of the Winter Olympics has had an average gain of 1.3% (median: 1.6%) with positive returns 80% of the time. The most notable outperformance came in 1992 when French equities rallied 5.4% during the Albertville games while the S&P 500 gained just 0.1%. On the other hand, the S&P 500 considerably outperformed South Korean equities in the 2018 Games in PyeongChang, resulting in a performance spread of 4.6%. In fact, in each of the three most recent Winter Olympic Games, US stocks outperformed stocks in the host country by an average of 2.5%. Countries often bid to host the Olympics in order to shed a positive light on their country, but it hasn’t always helped their stock markets outperform in the short run. To track the performance of China during the Olympic Games this year (starts on 2/4 and ends on 2/20), subscribe to Bespoke Premium today to gain access to our trend analyzer & chart scanner.
Bespoke’s Morning Lineup – 2/2/22 – Digging Out
See what’s driving market performance around the world in today’s Morning Lineup. Bespoke’s Morning Lineup is the best way to start your trading day. Read it now by starting a two-week trial to Bespoke Premium. CLICK HERE to learn more and start your trial.
“It is an old device in Wall Street—to change the colour of the certificates in order to make them more valuable.” – Edwin Lefèvre
Everyone knows that stock splits are completely meaningless when it comes to a company’s fundamentals, but yet companies continue to split their stocks anyway, and more often than not, the price of a stock gets at least a short-term boost from the announcement. The latest example was last night when Alphabet (GOOGL) said they would split the stock on a 20-1 basis. So rather than trading for around $3,000 per share, GOOGL will trade for around $150 per share post-split.
Again, the split means nothing in terms of GOOGL’s fundamentals, but it does make the stock more palatable for investors looking to add a position. In a world where most brokerage firms now offer fractional shares, a company’s share price should be even less of a factor, but from the psychological perspective of an individual investor, it feels better to own a few shares of a company’s stock rather than a fraction of one share of a company’s stock. GOOGL’s split wasn’t the only news for the stock last night. The company also reported a very large earnings beat, and while the stock split is no doubt a contributing factor behind today’s move, the earnings results are the primary driver of today’s move.
GOOGL’s earnings results are helping to push futures in the green this morning as the Nasdaq is indicated to open up by more than 1%. S&P 500 futures are also firmly higher, while the Dow, where GOOGL is not represented (at least for now) is only looking at fractional gains. Besides GOOGL. strong results from AMD are also contributing to the positive tone in tech, but that strength has been offset from weak results from PayPal (PYPL) and Starbucks (SBUX).
In economic news, the only report of the day is ADP Private Payrolls, and it was a big dud. While economists were forecasting an increase of nearly 200K jobs in January, the actual reading was a decline of 301K as the Omicron wave that spread across the country caused major – although likely temporary- disruptions to the economy.
Read today’s Morning Lineup for a recap of all the major market news and events from around the world, including the latest US and international COVID trends.
US stocks have seen some big moves over the last five trading days as the Nasdaq 100 (QQQ) has rallied close to 6%. Behind QQQ, the S&P 100 (OEF) is also up over 5%. At the other end of the spectrum, the three weakest indices are all connected to small caps. In other words, the latest bounce has been driven completely by mega-caps. Even after the market has started to dig itself out of the January hole, every major index ETF remains below its 50-day moving average (DMA) and nearly half are still oversold, including the Nasdaq 100.

Turning back to GOOGL, the stock is currently indicated to open up by a little over 10% this morning which would be the 9th time in its history that the stock gapped up over 10% in reaction to earnings with the last occurrence all the way back in October 2015. In the prior eight periods where GOOGL gapped up over 10% in reaction to earnings, the stock continued higher during the trading day five out of eight times for a median gain of 0.19%.

Start a two-week trial to Bespoke Premium to read today’s full Morning Lineup.
Daily Sector Snapshot — 2/1/22
Bespoke Stock Scores — 2/1/22
Bitcoin Oversold for a Month Straight
Bitcoin has rallied over 10% since the low a little over a week ago, but that still leaves the world’s largest cryptocurrency down over 40% below its all-time high set back in November. In fact, the past few months have seen Bitcoin trade in a steep well-defined downtrend which the rally over the past several days rally has now run up against.

While that downtrend line has the potential to act as resistance, the steep drop has resulted in Bitcoin consistently trading at oversold levels (measured in standard deviations from its 50-DMA). In fact, today marks the 30th consecutive day in which Bitcoin has traded at least one standard deviation below its 50-DMA.

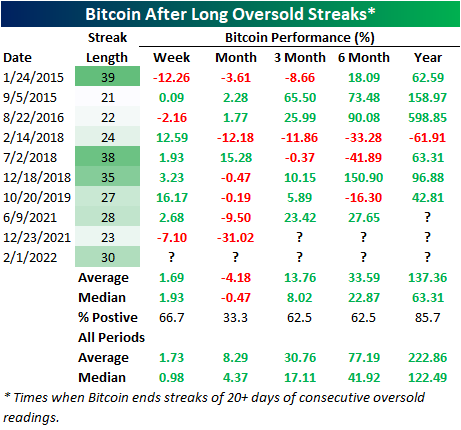
As for the consistency of oversold readings, there have only been ten streaks including the most recent one in which Bitcoin has been oversold for at least 20 straight days. The current stretch is now the longest since December 2018. Other than that streak, only those ending in January 2015 and July 2018 also extended for at least 30 days.

While the current streak is not over, in the table below we show the performance of Bitcoin after the end of those past streaks of oversold readings that went on for at least 20 days. As shown, the end of those streaks have typically seen a bounce in the week after with positive returns two-thirds of the time and gains that are in line with the historical average. One month later has typically seen the crypto fall further, though, with positive performance only a third of the time. Three and six-month performance have been more consistent to the upside with positive returns nearly two-thirds of the time but average and median gains that are smaller than what Bitcoin has averaged across all other three and six-month periods since 2014. One year later has been a similar story with below average forward returns but a very high consistency of positive returns. Click here to view Bespoke’s premium membership options.
Bespoke Market Calendar — February 2022
Please click the image below to view our February 2022 market calendar. This calendar includes the S&P 500’s average percentage change and average intraday chart pattern for each trading day during the upcoming month. It also includes market holidays and options expiration dates plus the dates of key economic indicator releases. Start a two-week free trial to one of Bespoke’s three research levels.
