January Peak in Claims Wearing Off
The January spike in jobless claims has continued to unwind in the most recent week’s data. Seasonally adjusted initial claims fell by 16K to 223K versus last week’s 1K upwardly revised reading of 239K. That does not set a new low for claims, only reaching the lowest level since the last week of December and still 35K above the low from the week of December 3rd, but it does mark a third consecutive week of improvement.

On a non-seasonally adjusted basis, claims improved falling to 228.9K. The seasonal peak in claims is now well in the rearview and this week’s reading was essentially right in line with the levels of the comparable week for the few years prior to the pandemic. Historically, the current week of the year has been mixed when it comes to seasonal patterns with claims rising week over week 44% of the time, but in recent years the seasonal tendency has been one of improvement. Other than last year, every year since 2016 has seen NSA claims fall WoW during the current week of the year (6th) with this year marking the largest decline of those.

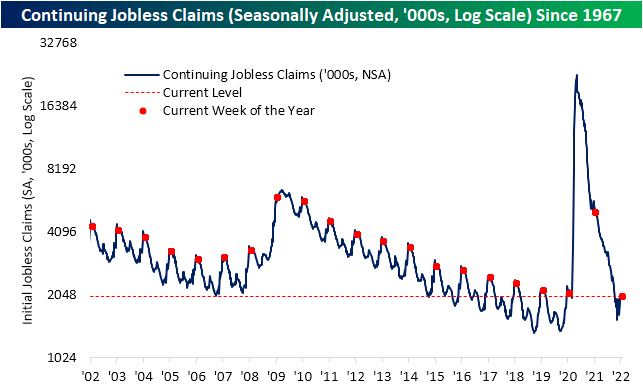
Continuing claims are delayed an extra week to the initial jobless claims number meaning the most recent print is as of the last week of January. Continuing claims remain below the range of readings in the few decades prior to the pandemic, unchanged versus last week at 1.621 million.

While initial claims are in line with pre-pandemic readings for the same week of the year, continuing claims set a new low for the current week of the year. Click here to view Bespoke’s premium membership options.
The Bespoke 50 Growth Stocks – 2/10/22
The “Bespoke 50” is a basket of noteworthy growth stocks in the Russell 3,000. To make the list, a stock must have strong earnings growth prospects along with an attractive price chart based on Bespoke’s analysis. The Bespoke 50 is updated weekly on Thursday unless otherwise noted. There were no changes to the list this week.
The Bespoke 50 is available with a Bespoke Premium subscription or a Bespoke Institutional subscription. You can learn more about our subscription offerings at our Membership Options page, or simply start a two-week trial at our sign-up page.

The Bespoke 50 performance chart shown does not represent actual investment results. The Bespoke 50 is updated weekly on Thursday. Performance is based on equally weighting each of the 50 stocks (2% each) and is calculated using each stock’s opening price as of Friday morning each week. Entry prices and exit prices used for stocks that are added or removed from the Bespoke 50 are based on Friday’s opening price. Any potential commissions, brokerage fees, or dividends are not included in the Bespoke 50 performance calculation, but the performance shown is net of a hypothetical annual advisory fee of 0.85%. Performance tracking for the Bespoke 50 and the Russell 3,000 total return index begins on March 5th, 2012 when the Bespoke 50 was first published. Past performance is not a guarantee of future results. The Bespoke 50 is meant to be an idea generator for investors and not a recommendation to buy or sell any specific securities. It is not personalized advice because it in no way takes into account an investor’s individual needs. As always, investors should conduct their own research when buying or selling individual securities. Click here to read our full disclosure on hypothetical performance tracking. Bespoke representatives or wealth management clients may have positions in securities discussed or mentioned in its published content.
Chart of the Day: Intraday Range Cools Off
Bespoke’s Morning Lineup – 2/10/22 – The CPI You’ve All Been Waiting For
See what’s driving market performance around the world in today’s Morning Lineup. Bespoke’s Morning Lineup is the best way to start your trading day. Read it now by starting a two-week trial to Bespoke Premium. CLICK HERE to learn more and start your trial.
“Things there are no solution to: Inflation, bureaucracy & dandruff.” – Malcolm Forbes
It’s finally here, the CPI report the world has been waiting for. Today’s CPI report for January is very likely one of the most-anticipated economic indicators of the year so far and leading up to it, futures were mixed with the Dow higher while the S&P 500 and Nasdaq marginally lower. That’s certainly a tentative tone given the strong earnings we have seen from the likes of Disney (DIS), Coca-Cola (KO), Uber (UBER), Mattel (MAT), and Twilio (TWLO), which are all up sharply in reaction to their reports. Treasury yields were likewise little changed heading into the report with the 2-year and 10-year maturities trading pretty much unchanged relative to yesterday’s close (1.34% and 1.93%, respectively).
CPI came in higher than forecasts with the headline reading surging 0.6% compared to forecasts for an increase of 0.4%. Core CPI also rose by the same amount versus forecasts for an increase of 0.5%. On a y/y basis, headline CPI was up 7.5% which was the highest reading since 1982. Core CPI was up 6.0% which was also stronger than expected and the highest since 1982. The initial market reaction has been – you guessed it – lower with equity futures selling off and treasury yields moving higher as the 10-year approaches 2.0% and the 2-year trades at 1.45%.
The other indicator released this morning was Jobless Claims which actually came in slightly lower than expected on an initial basis and slightly higher than expected on a continuing basis.
Read today’s Morning Lineup for a recap of all the major market news and events from around the world, including the latest US and international COVID trends.
Inflation has easily been the number one concern of investors for the last year now, but in looking at market performance on the day of prior reports since the start of 2021, you wouldn’t necessarily think the markets were preoccupied with inflation. Since the start of 2021, there has only been one CPI report that has come in weaker than expected (August report released on 9/14/21). Of the remaining 12 reports, eight have been higher than forecasts, and four have been right in line with estimates.
Given all those higher than expected reports, you would think that the average S&P 500 performance on CPI days since the start of 2021 would be negative and Treasury yields would move higher, but that hasn’t really been the case. As shown in the table below, the S&P 500’s average performance on the day of CPI reports since the start of 2021 has been a gain of 0.25% (median: -0.04%) with gains 61.5% of the time. Moves in the Treasury market have been even more counter-intuitive. On the 13 prior report days since the start of 2021, the yield on the 10-year US Treasury has dropped an average of nearly 2 basis points (median: -0.6 bps) with increases in yield less than a third of the time.

Start a two-week trial to Bespoke Premium to read today’s full Morning Lineup.
Daily Sector Snapshot — 2/9/22
Chart of the Day: Bitcoin Breaks Its Downtrend
January 2022 Headlines
Bespoke’s Morning Lineup – 2/9/22 – A Half Correction
See what’s driving market performance around the world in today’s Morning Lineup. Bespoke’s Morning Lineup is the best way to start your trading day. Read it now by starting a two-week trial to Bespoke Premium. CLICK HERE to learn more and start your trial.
“A deception that elevates us is dearer than a host of low truths.” – Marina Tsvetaeva
Building upon yesterday’s momentum, US equity futures look to trade higher again this morning following strong sessions overnight in Asia and Europe. While there hasn’t been much in the way of a concrete catalyst, lower COVID case numbers and hospitalizations coupled with a trend of easing restrictions in the states that had some of the strictest mandates has investors optimistic that the long-delayed return to normal may be on the horizon. Today’s economic calendar is light, but there are still a ton of earnings to contend with, and we’re now just 24 hours from the biggest economic indicator of the week (and probably the month) with tomorrow’s CPI report for January.
Read today’s Morning Lineup for a recap of all the major market news and events from around the world, including the latest US and international COVID trends.
Yesterday’s rally and this morning’s strength in the futures markets have been welcomed by the bulls even if there wasn’t much in the way of a catalyst for the move. As markets look to stabilize after some recent volatility, below we provide a quick snapshot of where the major indices stand on a YTD basis and relative to their 50-day moving averages (DMA). The Nasdaq 100 (QQQ) has been the hardest hit YTD and heads into today’s trading session with a decline of nearly 10%. It is also the only major US index trading more than 5% below its 50-DMA. Along with the Russell 2000 (IWM), QQQ is the only other index ETF trading at ‘oversold’ levels (>1 standard deviation below its 50-DMA).
The technical definition of a market correction is a decline of 10% or more from a peak, and with the S&P 500 currently down just over 5% YTD, 2020 would currently qualify as a ‘half-correction’. SPY has barely moved out of oversold territory, but like the Nasdaq 100, it also remains below its 50-DMA. Finally, the Dow is often considered to be one of the least representative of the major indices, and it’s living up to that reputation this year. With a decline of just over 2% YTD, the Dow’s performance looks nothing like any of the other indices, and it’s the only one that is also anywhere close to trading above its 50-DMA. In fact, if current levels in the futures hold, it will be the only index ETF above its 50-DMA today.

Start a two-week trial to Bespoke Premium to read today’s full Morning Lineup.