B.I.G. Tips – Let It Go
Small Businesses Concerned Over Quality
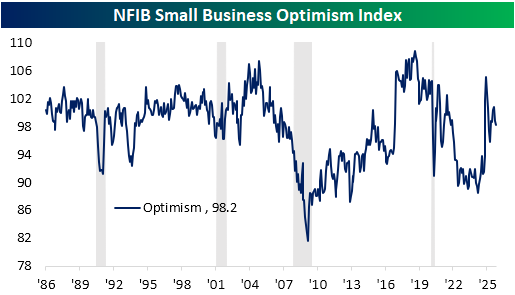
This morning’s only economic report was the NFIB’s Small Business Optimism Index. It came in weaker than expected, falling to 98.2 versus forecasts of 98.3. The index has now fallen in back-to-back months as it hovers in the 40th percentile of its historical range..
Of the inputs to the headline number, breadth was actually mixed with four declining categories, four rising, and the remainder going unchanged. As for the non-input categories, breadth was far weaker, with only two indices avoiding declines. As for those that did drop, there were a handful that saw bottom decile monthly declines.
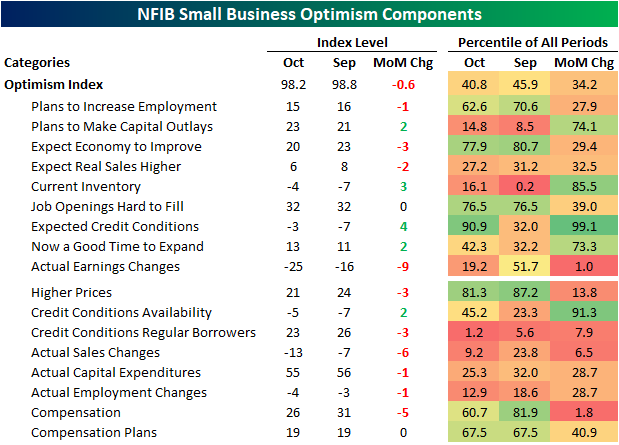
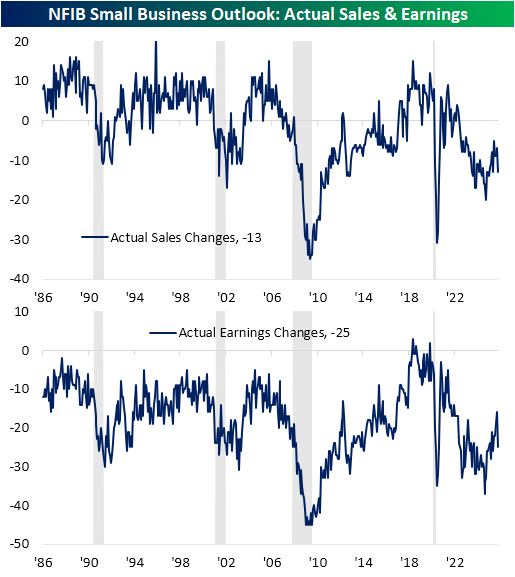
Of the inputs to the headline number, the most concerning decline was in actual earnings changes. That index fell 9 points MoM, which ranks as the sixth largest monthly decline in the index’s history (data going back to 1986). Given that those are bottom-line changes, the cause for weaker earnings could be weaker revenues, higher costs, or a mix of both. However, weaker revenues appear to be the culprit.
For starters, the index for higher prices remains in the top quintile of readings throughout the survey’s history, but there was a 3-point decline in October. Meanwhile, the index for actual sales changes (not an input into the overall optimism index) fell by a more significant 6 points in October to the lowest level since May. That six-point decline ranks in the 6th percentile of monthly moves, and the current level of the index is now in the bottom decile of historical readings. Interestingly, despite the moves in those indices, the share of respondents who reported poor sales as their biggest problem was unchanged at 10%.
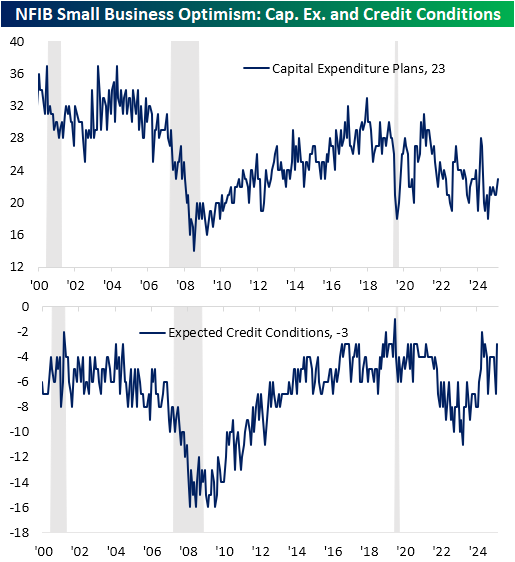
One bright spot of the October report concerned financing. As rates have continued to fall, there has been an uptick in capex plans and expected credit conditions. For the latter, the 4-point jump month-over-month was one of the largest one-month increases on record, and current levels are also at the high end of the past few decades’ range.
As noted earlier, for the topics labeled as small businesses’ biggest problems, poor sales didn’t move in October, and at 10% it ranks as the fourth-biggest issue of the 10 listed. Ahead of poor sales, inflation took a step back, falling 2 percentage points to 12% of responses, and taxes fell an identical amount to 16% of responses. The single most commonly reported problem in October was quality of labor. Of responding firms, 27% reported this as the biggest issue. In spite of other weak indicators concerning labor markets, that was the strongest reading since November 2021 and was up significantly from September. In fact, the 9 percentage point jump marked a record monthly gain. What’s more, the share reporting cost of labor as the biggest issue actually fell 3 percentage points to 8%.
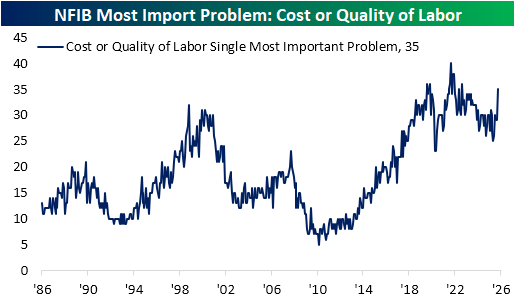

Chart of the Day – Impressive Streaks on Both Sides of the Equator
Bespoke’s Morning Lineup – 11/11/25 – Defense Stocks Stand Out
See what’s driving market performance around the world in today’s Morning Lineup. Bespoke’s Morning Lineup is the best way to start your trading day. Read it now by starting a two-week trial to Bespoke Premium. CLICK HERE to learn more and start your trial.
“The test of success is not what you do when you are on top. Success is how high you bounce when you hit the bottom.” – George S. Patton

Below is a snippet of commentary from today’s Morning Lineup. Start a two-week trial to Bespoke Premium to view the full report.
Futures are in hangover mode after yesterday’s big rally to start the week, which put a dent in a good chunk of last week’s decline. At this point, S&P 500 futures indicate just a modest decline of 0.2% at the open, while the Nasdaq is down twice that. The Treasury market is closed for Veterans Day, but both crude oil and gold are up about 0.8% while cryptocurrencies are lower. In Europe, the STOXX 600 is up another 0.8%, while Asian stocks were mixed.
Judging by the metrics of General Patton’s quote above, the bounce of last April’s low was one of the most successful of all time, and even the bounce off last week’s test of the 50-DMA has, initially at least, been successful. On this Veterans Day, we want to thank anyone who has served in the US Armed Forces for their service. Everyone in the country appreciates their service.
Given the Veterans Day holiday, we wanted to look at how aerospace and defense stocks have performed so far this year. From last November through early April, the group traded mostly sideways, so while it didn’t rally with the broader market to close out 2024, it didn’t feel much of the effects of the tariff-tantrum in March and April. Since those April lows, though, the sector has taken off and not looked back. Like the S&P 500, the group tested its 50-DMA last Friday but managed to bounce and stay above that level.
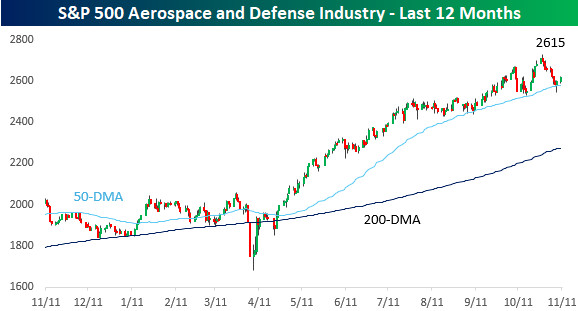
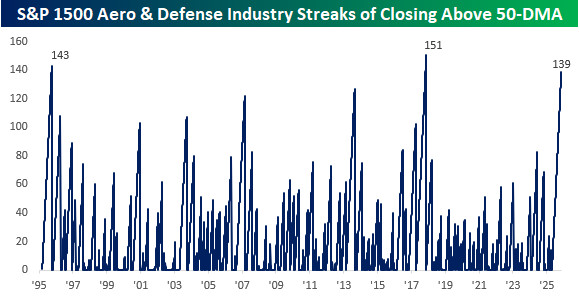
With the successful test of the 50-DMA, the Aerospace and Defense industry has closed above its 50-DMA for 139 trading days. That’s the longest streak since a record 151 trading days in 2017 and ranks as the third-longest in the last 30 years.
The Closer – AI Credit, Consumer Expectations, Mortgages – 11/10/25
Log-in here if you’re a member with access to the Closer.
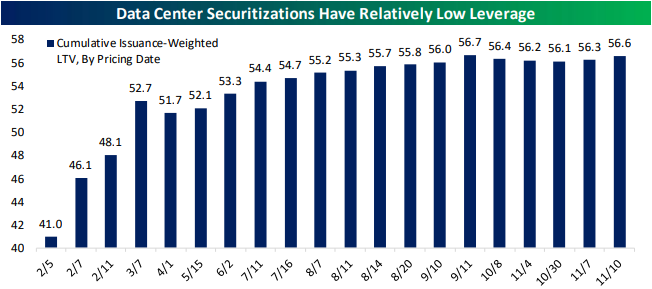
Looking for deeper insight into markets? In tonight’s Closer sent to Bespoke Institutional clients, we begin with a dive into debt related to datacenters and AI names (pages 1 and 2). We then pivot into the latest data from the New York Fed’s Survey of Consumer Expectations (pages 3 – 5) including some other housing data from ICE’s Mortgage Monitor report (page 5).
See today’s full post-market Closer and everything else Bespoke publishes by starting a 14-day trial to Bespoke Institutional today!
Daily Sector Snapshot — 11/10/25
Chart of the Day: Triple Play Selloffs
Home is Where the Pain Is
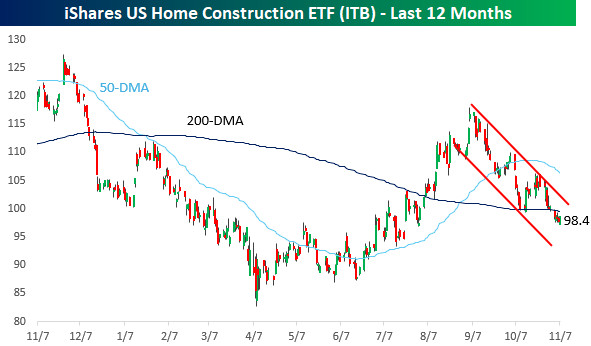
Normally, on a day when the S&P 500 rallies more than 1%, you would expect to see most stocks trading higher along with it, but if there’s one group that seems to lag the market every day lately, it’s the homebuilders. Right on cue, the group’s performance today trails the overall market so much so that the iShares Home Construction ETF (ITB) is down on the day, just like it’s down on the year as well.
It’s been a painful year for homebuilders. You have to go back nearly a full year to find the sector’s 52-week high, and from that peak in late November last year through the tariff-tantrum low, ITB plunged over 30%. Through late August, the sector erased most of its prior losses, but it has been a painful fall as Americans remain locked in their current homes because of low-rate mortgages, and most prospective buyers don’t have anywhere near enough money to afford a starter home. This is why the average first-time homebuyer is now a record 40 years old. As shown below, ITB remains stuck in a steep short-term downtrend, below its 200-DMA and much closer to 52-week lows than highs.
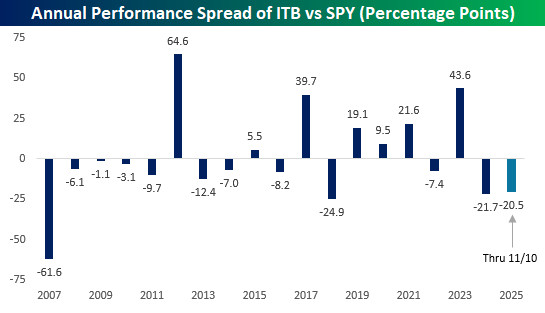
It’s been a bad year for homebuilders, but the underperformance versus the market isn’t anything new. The year’s not over yet, but last year, ITB underperformed SPY by an even larger amount than it has YTD. In 2018, ITB underperformed by close to 25 percentage points, and back in 2007, the performance spread was over 60 percentage points in favor of the S&P 500.
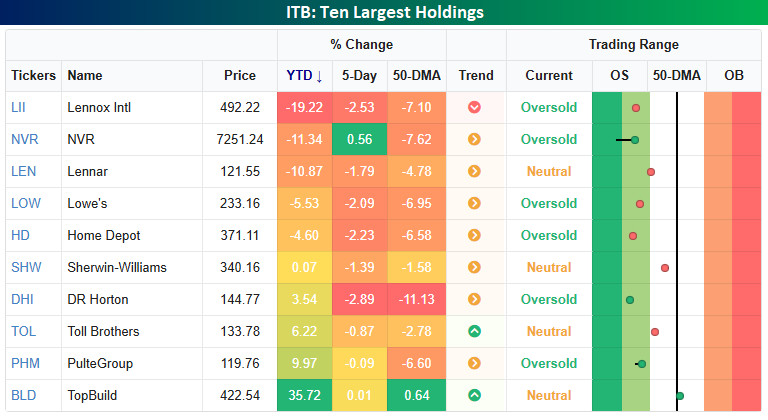
Looking at the performance of the ten largest holdings in ITB, YTD returns have been mixed. As its name suggests, ITB is a home construction ETF, so it’s not just made up of homebuilder stocks. Of the top ten holdings, only five stocks would be considered pure-play homebuilders, and only two of them – NVR and Lennar – are down YTD. The worst performing stock of the group has been Lennox International (LII) with a decline of close to 20% YTD, while TopBuild (BLD), another non-homebuilder company, has rallied over 35%. It’s also the only stock listed that has managed to outperform the S&P 500.
Overall, six of the ten stocks shown are oversold, and all but BLD are below their 50-DMAs. For much of the last year, investors in the homebuilding space would say that lower rates would provide a tailwind for the sector. This year, though, the 10-year yield has declined from a peak of 4.8% in January to 4.1% now, and yet homebuilders haven’t been able to get out of their own way.
Not a Bespoke client? We’d love for you to give our equity research platform, Bespoke Premium, a try. You can sign up for complimentary access for 14 days at this link to start receiving our daily emails today!

Bespoke’s Morning Lineup – 11/10/25 – T.G.I.M
See what’s driving market performance around the world in today’s Morning Lineup. Bespoke’s Morning Lineup is the best way to start your trading day. Read it now by starting a two-week trial to Bespoke Premium. CLICK HERE to learn more and start your trial.
“When they call the roll in the Senate, the Senators do not know whether to answer ‘Present’ or ‘Not Guilty’.” – Theodore Roosevelt
Below is a snippet of commentary from today’s Morning Lineup. Start a two-week trial to Bespoke Premium to view the full report.
US equity futures are strong to start the week as the government shutdown nears an end, lifting investor spirits. Pretty soon, we may even have economic data again! The S&P 500 is indicated to open higher by just shy of 1% while the Nasdaq is up 1.5%. It may be strange to think that the market rallied in early October when the shutdown first started, and now it’s rallying when the government is poised to reopen! But investors are breathing a sigh of relief. A short shutdown is easily digestible, but the longer it lasted, the greater potential it had to ground US air travel to a halt, and that would have had major economic implications. And that’s just one of many ways the shutdown impacts overall economic activity, not to mention the hundreds of thousands of employees who haven’t been getting paid.
As stock futures rally, treasury yields are 3 to 4 bps higher, crude oil is only fractionally higher at just over $60, but gold is surging with a gain of 2.5% and back above $4,100. Meanwhile, crypto has also responded very well to the news of the shutdown ending, as Bitcoin is back above $106K and Ether trades above $3,600.
Asia was the first market to open following news that the shutdown was coming to an end, and markets started the week with broad-based gains. South Korea surged 3.0% followed by Hong Kong (+1.6%) and Japan (1.3%). Chinese inflation came in stronger than expected, reversing September’s deflationary reading (-0.3% y/y up to 0.2% y/y), but PPI remained negative as it has for an astonishing 37 straight months with a 2.1% y/y decline. There’s also some relief as the Chinese government relaxed some of its restrictions on rare earth exports and resumed exports of Nexperia chips.
Europe picked up right where Asia left off this morning, and the STOXX 600 is up 1.5% even as November investor confidence, as measured by Sentix, declined to -7.4 from -3.9 and below expectations for -5.4. Leading the way higher, Italy and Germany are up over 2%, but every major national equity benchmark is up at least 1%.
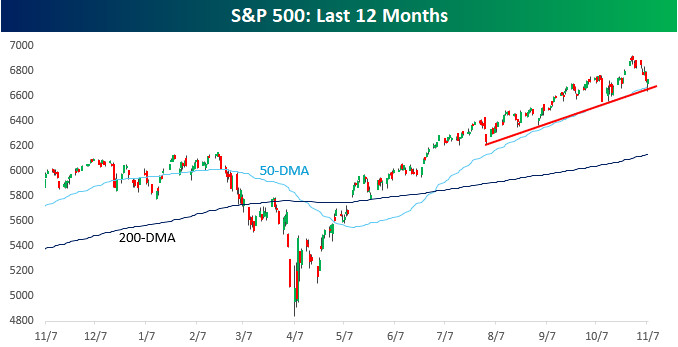
This morning’s rally to start the week comes as the S&P 500 and Nasdaq both successfully tested short-term uptrend lines and their 50-DMAs on Friday. If the morning gains can hold through the trading session, bulls will likely feel even more emboldened.
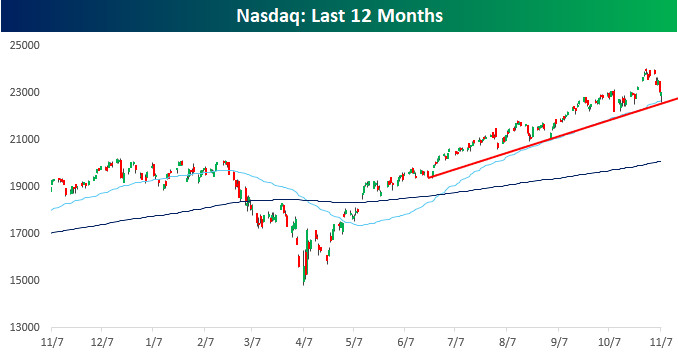
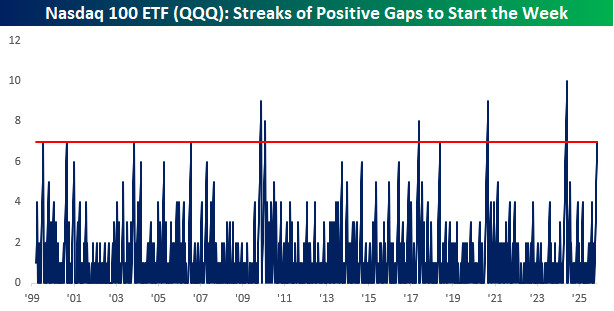
With today’s rally, both the S&P 500 and Nasdaq are on pace to gap up to start the week for the seventh straight week. That’s an impressive run and just the 15th such streak for the S&P 500 SPDR ETF (SPY) since it launched in 1993 and the 11th streak of seven or more weeks since the Nasdaq 100 ETF (QQQ) started trading in 1993. The chart below shows streaks of positive starts to the week for QQQ since it started trading in 1999, and the current streak is the longest since the 10-week record streak that ended in June of last year.
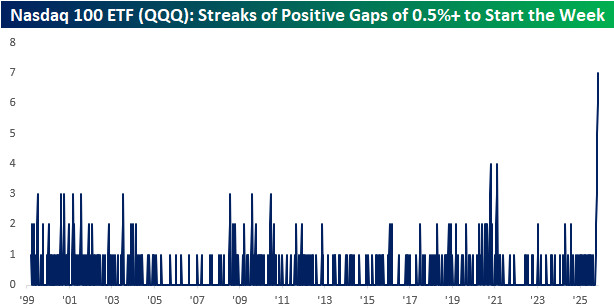
What’s even more impressive about the streak in QQQ is that every one of the positive opens has seen QQQ gap up at least 0.5% at the open. That’s the longest streak of 0.5%+ upside gaps to start a week in the ETF’s history.
Brunch Reads – 11/9/25
Welcome to Bespoke Brunch Reads — a linkfest of some of our favorite articles over the past week. The links are mostly market-related, but there are some other interesting subjects covered as well. We hope you enjoy the food for thought as a supplement to the research we provide you during the week.
Tear Down This Wall: On November 9, 1989, the Berlin Wall, the Cold War’s most infamous symbol of division, was opened. For nearly three decades, the Wall had split families, friends, and a city in half, separating democratic West Berlin from communist East Berlin under tight Soviet control. That evening, confusion over a poorly worded announcement by East German official Günter Schabowski led to thousands of East Berliners flooding the checkpoints, demanding to cross. Overwhelmed border guards, unsure of orders, eventually swung the gates open.
The scene that followed was electric. Crowds from both sides climbed atop the Wall, hammering at it with chisels and fists, embracing, singing, and waving flags. Within months, East Germany’s government would fall, and less than a year later, Germany itself would reunite. The Iron Curtain began to crumble, and with it, the Cold War world order that had defined the 20th century.

AI & Technology
The AI Boom’s Real Economy Problem (Nonconsensus)
Meta’s earnings last week showed that huge AI investments aren’t translating into big revenue gains. The company is spending about $70 billion a year to boost ad performance but seeing only a few billion in added revenue. Big Tech as a whole faces the same issue of spending heavily on AI while the payoff, so far, looks limited. [Link]
Continue reading our weekly Brunch Reads linkfest by logging in if you’re already a member or signing up for a trial to one of our two membership levels shown below! You can cancel at any time.
