Daily Sector Snapshot — 5/4/22
The Quitter Market
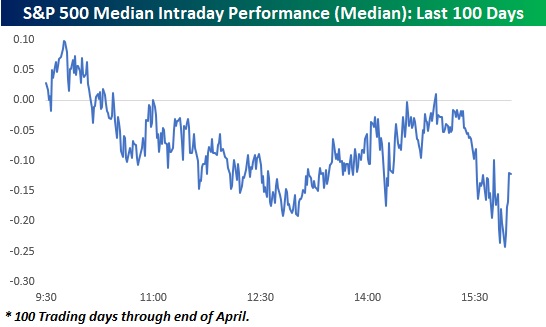
If it seems to you like the market simply can’t hold on to gains this year, you aren’t mistaken. The chart below shows an intraday composite of the S&P 500 on a median basis over the last 100 trading days through the end of April. The general pattern during this period has been for the market to open modestly higher, but then sell off for the remainder of the morning. It has then regained its footing shortly after mid-day but then sells off into the close.
How does the last five months or so compare to history? The charts below really put the recent trend of intraday weakness into perspective.
The first chart shows the number of days over a rolling 100-trading day period that the S&P 500 tracking ETF (SPY) traded in positive territory on an intraday basis but finished the day down. The reading currently stands at 38 and was as high as 40 (red line) in the last week of April. As shown in the chart below, there hasn’t been another period that the S&P 500 has had so much trouble holding onto intraday gains in more than a decade (October 2010)!

For the Nasdaq 100 (QQQ), it has been a similar story. As recently as April 22nd, the trailing number of times in the last 100-trading days that QQQ traded in positive territory on an intraday basis but finished the day lower reached 42 and currently stands at 40. Like SPY, the recent reading of 42 was the highest number of occurrences in a 100-trading day span since October 2010.
For both indices, the currently elevated frequency of giving up intraday gains has been extremely uncommon for the post-financial crisis period. Interestingly enough, though, in the ten years before the financial crisis, these types of periods were a lot more common, especially for the Nasdaq. Could it have anything to do with the fact that the last 12 years have also been one of the more accommodative monetary environments investors have ever experienced? Click here to learn more about Bespoke’s premium financial markets research.

Bespoke’s Consumer Pulse Report — May 2022
B.I.G. Tips – Fed Day Reversals
Chart of the Day: Breadth Far From Extreme Levels
Bespoke’s Morning Lineup – 5/4/22 – Let the 50 Basis Point Hikes Begin
See what’s driving market performance around the world in today’s Morning Lineup. Bespoke’s Morning Lineup is the best way to start your trading day. Read it now by starting a two-week trial to Bespoke Premium. CLICK HERE to learn more and start your trial.
“During this time of reopening, we are likely to see some upward pressure on prices…But those pressures are likely to be temporary as they are associated with the reopening process.” – Jerome Powell

Below is a snippet of content from today’s Morning Lineup for Bespoke Premium members. Start a two-week trial to Bespoke Premium now to access the full report.
The above comments from Fed Chair Jerome Powell were made a year and six days ago today, and we’d be willing to bet that when he made them he never imagined that one year later CPI would be over 8.5% on a y/y basis and accelerating. It just goes to show that predicting the future is hard, and today’s foregone conclusions are often hindsight’s most embarrassing moments.
Futures are actually higher this morning, and while we’re still far from the closing bell, a positive close would be the S&P 500’s first three-day winning streak since late March. Before we can get there, though, we still have to digest the weaker than expected ADP Private Payrolls Report which came in at 247K compared to forecasts for an increase of 385K. At 10 AM, we’ll get the ISM Services report, which is expected to show a modest uptick from 58.3 to 58.5. The big event of the day, obviously, will be the FOMC rate decision at 2 PM and the press conference at 2:30. For much of Powell’s tenure as Fed Chair, when he speaks, investors sell, so hopefully for the bulls, the most hawkish outcome is already priced in.
In today’s Morning Lineup, we recap overnight events in Asia and Europe (pg 4), India’s emergency rate hike (pg 4), the war in Ukraine (pg 4), other European economic data (pg 5), and a lot more.
Mick Jones of The Clash couldn’t decide whether he should stay or go, and in a similar way, the market can’t decide whether it wants to rise or fall. While the ultimate direction this year has been to the downside, in looking at the intraday range of the S&P 500 over the last 100 trading days, we’ve increasingly seen a trend where the market trades in positive and negative territory in the same session.
The chart below shows the 100-day rolling number of days where the S&P 500 tracking ETF (SPY) traded in both positive and negative territory relative to the prior day’s close. Through yesterday’s close (5/3), the S&P 500 traded in positive and negative territory on 69 of the last 100 trading days. That’s slightly off the recent peak of 71, but as shown in the chart, the market hasn’t been this indecisive since July 2014. Make up your mind already!

Start a two-week trial to Bespoke Premium to read today’s full Morning Lineup.
Bespoke Stock Scores — 5/3/22
Daily Sector Snapshot — 5/3/22
B.I.G. Tips – 50 bps Hike Coming Right Up
Asset Class Performance
The S&P 500 (SPY) is down nearly 4% since the last FOMC meeting on March 16th when the Fed lifted off of the “zero bound” by hiking rates 25 basis points. As we approach the second rate hike of this cycle tomorrow, below is a snapshot of recent asset class performance using our key ETF matrix. For each ETF, we show its total return since the close on the date of the last FOMC meeting (3/16) as well as its total return since February 19th, 2020, which was the stock market’s closing high prior to the start of the COVID pandemic.
Starting with performance since the Fed hiked rates for the first time back in March, we’ve seen across-the-board declines in US equities with the exception of a few sectors. Small-caps and the Nasdaq have been hit hardest since the March rate hike, while the Dividend ETF (DVY) has managed to post a small gain. Communication Services and Financials have been the hardest hit sectors with declines of 8%+, while Energy and Consumer Staples are both up more than 5%. Outside of the US, not one country ETF is up since the Fed hiked rates, and Germany and China are both down ~10%. The China ETF (ASHR) is down more than any ETF in our matrix since the first rate hike, but the 20+ Year Treasury ETF is right on its heels with a decline of 10.1%. Even gold and silver are now down since 3/16, while energy and agricultural commodities are in the green.
As asset prices have fallen in 2022, we’ve seen quite a few areas of financial markets really start to give up post-COVID gains. The S&P 500 has still posted a total return of nearly 28% since pre-COVID, but the small-cap Russell 2,000 is up less than 15% at this point. Looking at US sectors, Energy is up the most since 2/19/20 with a gain of 61%. Materials and Technology are still up 40%+, while Industrials and Financials are up just 18%. Two sectors — Utilities and Communication Services — have posted total returns of less than 10% since the pre-COVID high.
Outside of the US, India and Canada are both solidly green since the pandemic began, but countries like Brazil, Germany, Hong Kong, Italy, and Spain are all in the red. Commodity ETFs have been some of the best since the pandemic, although USO (oil) specifically is actually down 14% since the close on 2/19/20.
Treasury ETFs are down on a total return basis since pre-COVID, with TLT down the most at 15%. The only bond ETF that has offered some protection post-COVID is the inflation-protected TIP, which is up 8.42%. Click here to learn more about Bespoke’s premium financial markets research.
