All Day Rallies A Thing of the Past
It seems like a distant memory now, but Monday’s rally marked just the 13th time all year (and over the last 100 trading days) that the S&P 500 tracking ETF (SPY) opened higher and traded in positive territory all day (‘100% positive day’). The chart below shows the rolling 100-trading day total number of 100% positive days for SPY since 1994, shortly after the ETF launched. The current level of 13 is already well below the long-term average of 18, but last week, the reading was even lower at 12. The last time the 100-day rolling total was lower than that was in May 2009, and the lowest readings ever recorded were in periods beginning in October 2002 and September 2008 with just six in a 100-trading day span.
What makes the current period unique is how quickly the rate of 100% positive days has plummeted. 100 trading days ago, the rolling total was more than twice the current level at 29. Also, it was only in February 2021 (less than sixteen months ago) that the number of 100% positive days reached a record high of 33 on 2/4/21. That peak came just weeks before the Federal Government sent out the third and final round of stimulus checks. Just as massive amounts of fiscal and monetary stimulus helped to support markets during COVID, the withdrawal of these supports has introduced gravity back into the equation. Click here to learn more about Bespoke’s premium stock market research service.

Chart of the Day – Nasdaq 30% Off Highs
Richmond Reversal
In addition to weaker than expected preliminary S&P Global (formerly Markit) PMIs, another weak regional Fed manufacturing index hit the tape this morning. The Richmond Fed’s Manufacturing Composite dropped into contraction in May as the index hit its lowest level in two years. The 23-point month-over-month drop was also the second-largest decline on record behind the 49-point drop in April 2020.

Each regional Fed’s headline manufacturing number differs slightly in composition and the Richmond reading is made using shipments, new orders, and employment as inputs. As shown below, each of those indices experienced historic declines this month causing the massive drop in the composite. Breadth elsewhere in the report was not much better though. Other categories like capacity utilization, order backlogs, and average workweek also pulled back sharply. Meanwhile, expectations for several categories are in the bottom few percentile of their historical ranges going back to the start of the data in the 1990s. Overall, this month’s report showed a massive slowdown in activity that is consistent with other surveys that have come out this month.

Two of the inputs to the composite that also fell into contraction this month were new orders and shipments. New Orders have seen a small handful of larger declines with September of last year being the most recent one. New Orders were also much lower after that decline last fall. As for Shipments, the 31-point month-over-month decline ranks as the second-largest on record next to April 2020 when the index fell a whopping 77 points. While it does not necessarily outweigh the rapid deterioration in demand, one silver lining of the report was a further huge improvement in supply chains. The reading on Vendor Lead Times was sliced in half as the index remains below pre-pandemic levels.

Again, Employment is the third input to the composite and it was the sole input to remain in expansion in May. That being said, it too fell sharply versus the prior month. While that reading indicates lower mid-Atlantic manufacturers are currently net taking on more workers, expectations saw a record decline meaning hiring plans are likely to decelerate significantly in the near future. That is as wage growth has stalled out and the length of the average workweek has been cut.

Finally, in spite of supply chain improvements and weaker demand, prices have continued to rise unabated. Prices paid hit fresh record highs across both current conditions and expectations. Prices received are off-peak but the reading did tick up slightly in May. Click here to learn more about Bespoke’s premium stock market research service.

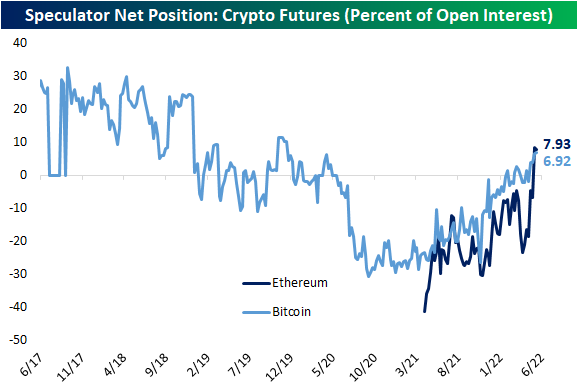
Speculators Bullish on Bitcoin
Bitcoin has been relatively flat in the past couple of weeks in the wake of the TerraUSD blowup. That is also in spite of further declines for equities which have been highly correlated to cryptos lately, especially on an intraday basis. As the two largest cryptos—Bitcoin and Ethereum—have traded more or less sideways, speculators appear to be getting a little more bullish. As we do each week, in last night’s Closer we highlighted how positioning data from the CFTC’s Commitments of Traders report showed speculators are positioned net long (meaning there is a higher share of open interest that are long the future than short) in Ethereum and Bitcoin futures. The latest data as of last Tuesday showed a net 7.93% of Ethereum futures were long. That was down slightly from the prior week but remains one of the strongest readings since the data began roughly one year earlier. Bitcoin open interest is similarly net long, with the latest reading rising to the highest level since November 2019. That means the highest share of speculators are anticipating higher bitcoin prices since before the pandemic when the crypto was trading below $10,000; nearly a third of what it is at today. Open interest back then was also a fraction of what it is now as well. Click here to learn more about Bespoke’s premium stock market research service.
Bespoke’s Morning Lineup – 5/24/22 – Anti-Social Media
See what’s driving market performance around the world in today’s Morning Lineup. Bespoke’s Morning Lineup is the best way to start your trading day. Read it now by starting a two-week trial to Bespoke Premium. CLICK HERE to learn more and start your trial.
“It can be terribly dangerous, even perilous, to assume that because people hold positions of responsibility they are therefore acting responsibly.” – David McCullough

Below is a snippet of content from today’s Morning Lineup for Bespoke Premium members. Start a two-week trial to Bespoke Premium now to access the full report.
That rally lasted long. After bouncing from the last hour on Friday through yesterday, US stocks are set to open down by over 1% this morning following Snap’s (SNAP) earnings warning and its comments regarding the weakening broader macroeconomic environment. Adding to the concerns regarding the economy, preliminary PMI readings out of Europe also came in lower than expected. The US versions of these reports will be released later this morning. Given these growth concerns, treasuries are rallying as the 10-year yield drops back down to 2.82%. Oil prices, however, are largely unchanged on the day.
In today’s Morning Lineup, we recap on the latest declines in the tech sector (pg 4), Asian and European markets (pg 4), COVID case numbers (pg 5), the latest economic data out of Asia and Europe (pg 5), and a lot more.
After a 1.87% gain for the S&P 500 (SPY) yesterday, we’re seeing the inverse of a “Turnaround Tuesday” this morning with SPY set to open lower by just over 1%. Since 1993 when SPY began trading, there have only been five prior instances in which SPY rose 1%+ on a Monday and then gapped lower by more than 1% the next morning. As shown below, SPY continued lower from the open to the close on four of the five prior Tuesdays, and one week from the Tuesday open, SPY was down all five times for an average decline of 2.3%. One step forward, two steps back.

Start a two-week trial to Bespoke Premium to read today’s full Morning Lineup.
Massive Sector Performance Spreads
There’s no questioning that the equity market has been extremely volatile this year. So far in 2022, the S&P 500 has averaged an absolute daily move of 121 basis points (bps). Although the broader index has been incredibly weak over the last 100 trading days (down 17.1%), performance among individual sectors has diverged widely, as Energy has gained 50.7% while the Communication Services sector has declined 32.0%. The 82.7 percentage point performance spread between the two sectors is one of the highest on record. Only July of 2009 and March of 2000 saw higher readings.

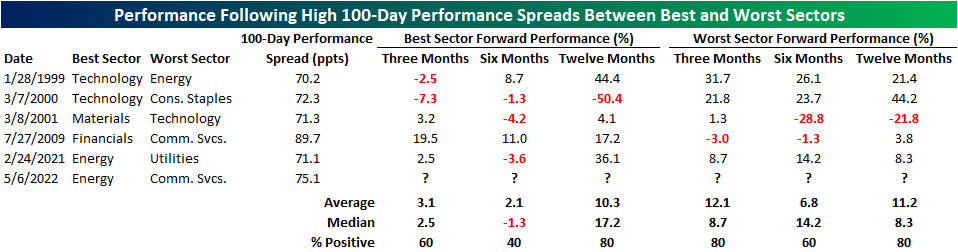
Since 1990, there have only been six times in which the best-worst 100-day performance spread crossed above 70 ppts for the first time in at least 50 trading days. This tends to occur amidst a volatile market environment. In the late 90’s, investors flooded into technology stocks while dumping ‘traditional’ stocks, which led to the Technology sector outperforming Energy by 70.2 percentage points in a 100-trading day span ending on 1/28/1999. When the dot-com bubble began to burst, the inverse occurred, and Materials outperformed Technology by 71.3% in the 100 trading days ending 3/9/2001. Coming out of the Global Financial Crisis, the Financials sector roared off of a depressed base, leading to outperformance against the Communication Services sector of 89.7 ppts. In late February of 2021, the Energy sector began to bounce back after the demand shock in the industry began to abate, while the Utilities sector remained relatively weak, leading to a 100-day performance spread of 71.1 ppts. This year, the sky-rocketing price of oil has propelled energy stocks higher while the Communication Services sector has been hampered by concerns that a peak demand environment was reached in 2020 and 2021 while valuation multiples have simultaneously contracted (largely due to the Fed’s hawkish pivot) pushing the 100-trading day performance spread out to 82.7 ppts.

As investors, we must remain forward-looking. So, what typically happens after dramatic performance spreads are reached between the best and worst sectors? It’s a small sample size, but based on the previous five occurrences, investors should consider rotating out of the best performing sector (which in this case would be Energy) after the spread hits 70 percentage points and move into the worst performing sector (Communication Services).
Three months after these occurrences, the worst-performing sector over the prior 100 trading days has booked a median gain of 12.1%, which is nine ppts better than that of the best performing sector. Six months later, the median performance of the worst-performing sector in the initial 100 trading days outperformed the best performing sector by 15.5 ppts. Interestingly, twelve months later, the best performing sector in the initial 100 trading days regained the lead over the worst-performing sector outperforming on a median basis by a margin of 17.2% to 8.3%. In terms of consistency, three and six months later, the previously worst performing sector outperformed the best performing sector three out of five times, but a year later, the previously best performing sector outperformed the worst-performing sector four out of five times. Click here to become a Bespoke premium member today!
Daily Sector Snapshot — 5/23/22
Breaking “the Mondays”
We’ve talked a lot in the past about how the overwhelming majority of the equity market’s gains in the last several decades have come outside of regular trading hours. When you consider the fact that active trading in US equity markets is less than 20% of all the time in a given week, it would make sense that most news occurs outside of trading hours. Therefore, when good news breaks outside of trading hours, stocks typically gap higher in response, and when there’s bad news, they gap lower at the next open.
So far, 2022 has generally been a case of the latter. With issues like rising prices, tighter monetary and fiscal policy, and the war in Europe, there really hasn’t been much in the way of good news for investors to digest over the weekends, and therefore, when markets do start a new week of trading, performance has been anemic at best. Three charts illustrate this trend.
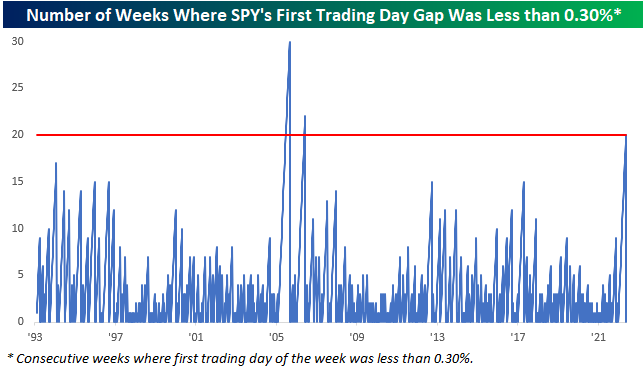
This morning the S&P 500 tracking ETF (SPY) gapped up 0.80% which was the largest upside gap in SPY to kick off a new trading week since late November. Today’s strong open also broke a streak of 20 straight weeks where SPY’s opening gap to kick off a week was negative or a gain of less than 0.30%. The chart below shows historical streaks where SPY’s opening gap on the first trading day of the week was negative or below 0.30%. The streak that just ended was the third-longest in SPY’s history, behind the 30-week streak ending August 2005 and the 22-week streak in June 2006. Both of those streaks came in the middle of the Fed’s early 2000s rate hike cycle where it raised rates by 25 bps for 17 straight meetings spanning June 2004 through June 2006 and took the Fed Funds Rate from 1.0% to 5.25% in the process.
Not only has there been a general lack of significant upside pressure to markets to kick off the trading week lately, but the trend has actually been in the opposite direction. Heading into today, SPY gapped lower to kick off the trading week 15 times in the last 19 weeks, and over the last six months, there were only 17 weeks where SPY gapped higher to kick off a week. In the entire history of SPY since the early 1990s, there have only been five other periods where there was a higher frequency of downside gaps to kick off a trading week in a six-month span, and they all peaked at 18.

Lastly, with the S&P 500 consistently opening lower to kick off the week, it would only make sense that the six-month average opening gap of the trading week would also be negative, and that’s exactly what we have seen. Over the last six months (26-weeks), SPY’s average opening gap to kick off a trading week has been a decline of 0.28% which is the weakest reading since the COVID crash (when there was a lot of bad news) and before that, the only two other weaker periods were in the six months ending in July 2009 and February 2002. If you were involved in the market in either of those periods, you remember that there was not a lot to be optimistic about in either period…sort of like now. They call it “the Mondays” for a reason, and lately, equities have had a bad case of them. Click here to become a Bespoke member today!
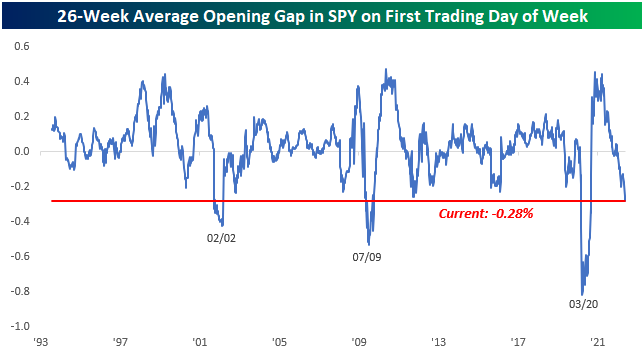
Chart of the Day: TIPS Breakevens Falling
Bespoke’s Morning Lineup – 5/23/22 – A Positive Start to the Week For a Change
See what’s driving market performance around the world in today’s Morning Lineup. Bespoke’s Morning Lineup is the best way to start your trading day. Read it now by starting a two-week trial to Bespoke Premium. CLICK HERE to learn more and start your trial.
“A library outranks any other one thing a community can do to benefit its people. It is a never-failing spring in the desert.” – Andrew Carnegie
Below is a snippet of content from today’s Morning Lineup for Bespoke Premium members. Start a two-week trial to Bespoke Premium now to access the full report.
There’s no need to adjust your screens this morning. Equity futures are actually trading higher. After flirting with bear market territory again last week, the S&P 500 is on pace to open up by about 1%. There’s little in the way of a positive catalyst to point to this morning, but bulls will take what they can get. Whether it can last until the closing bell is an entirely different question altogether.
The economic calendar is quiet today with the Chicago Fed National Activity Index the only report of note. Fed Presidents Bostic and George will be speaking later today, and there will be a number of retail-related earnings reports throughout the week. The only notable reports on the calendar today, though, are Advanced Auto (AAP) and Zoom Video (ZM) which are both after the close.
In today’s Morning Lineup, we recap events in the Russia-Ukraine war (pg 4), Asian markets (pg 4), other economic data out of Europe and Asia (pg 5), and a lot more.
Last week was a rough one for US equities, but it was horrendous for consumer stocks. Consumer Staples, which was modestly higher YTD heading into the week, plunged more than 8%, while Consumer Discretionary, which was already one of the worst-performing sectors YTD, got even worse falling just under 8%. Two other sectors (Industrials and Technology) were down over 3.5% while only three sectors (Energy, Health Care, and Utilities) managed to post gains. The YTD performance gap between Energy and Consumer Discretionary continues to get more ludicrous with each passing week as the gap now stands at just under 80 percentage points, and no other sector is within 40 percentage points of Energy!

Start a two-week trial to Bespoke Premium to read today’s full Morning Lineup.