B.I.G. Tips – Another Bad Day For the Economy
Bespoke Stock Scores — 7/26/22
Alphabet and Microsoft Down Headed Into Earnings
Both Microsoft (MSFT) and Alphabet (GOOG) are trading down over 2% heading into their earnings report amidst broader market weakness and wariness towards the tech sector. On a year-to-date basis, MSFT and GOOG are both down over 25% and are trading near their 52-week lows. The charts below show MSFT and GOOG over the last twelve months. On the bright side, the rate of change in the two stocks does appear to have support near current levels. However, they are both still in sustained downtrends. Click here to learn more about Bespoke’s premium stock market research service.

Since GOOG went public in 2004, there have only been four days in which the stock traded lower by two percent or more heading into the earnings report. The latest occurrence was on the day of the Q1 2022 report, which was the only time when it also reacted negatively following the earnings report. On average, the stock has gained 2.5% (median: 2.6%) following the report after trading lower by 2%+ leading into earnings. Historically speaking, GOOG has posted gains on its earnings reaction day 58% of the time, gaining an average of 1.7%. While the average and median returns below are positive, we would note that with just four occurrences the sample size is small.

Since October of 2001 (which is as far back as our earnings database goes), MSFT has traded lower by at least two percent in the session heading into an earnings report seven times. Again, the sample size is relatively small, but following every one of these prior occurrences, MSFT gained in the session following its earnings report, booking an average gain of 3.2% (median: 3.5%). For all earnings reports since October of 2001, MSFT has reacted positively to earnings 60% of the time. Click here to learn more about Bespoke’s premium stock market research service.
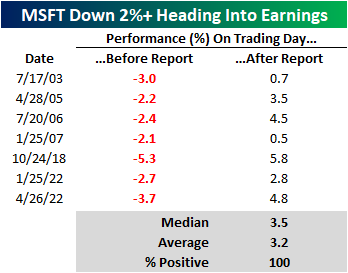
Chart of the Day – Hikes Spike the S&P
Bespoke’s Morning Lineup – 7/26/22 – Walmart (WMT) Comes Out of Left Field
See what’s driving market performance around the world in today’s Morning Lineup. Bespoke’s Morning Lineup is the best way to start your trading day. Read it now by starting a two-week trial to Bespoke Premium. CLICK HERE to learn more and start your trial.
“A good thing never ends.” – Mick Jagger

Below is a snippet of content from today’s Morning Lineup for Bespoke Premium members. Start a two-week trial to Bespoke Premium now to access the full report.
We said it was going to be a busy week yesterday, and that didn’t even include the surprise earnings warning from Walmart (WMT) after the close. While WMT shares are down sharply, it’s surprisingly having little impact on the broader markets where futures are only modestly lower heading into the open. Where they finish the day will be another story, and then after the close, we’ll hear from Alphabet (GOOGL) and Microsoft (MSFT) which are likely to have a bigger impact on how markets trade tomorrow.
Outside of equities, longer-term Treasuries are rallying this morning and sending the 10-year yield down to 2.74% and flattening the 10y3m portion of the yield curve down to just 26 basis points (bps) and closer to inverted levels, but don’t worry “it’s different this time”. As mentioned above, WMT’s warning was somewhat out of left field, and the timing was interesting as it came right before this week’s Fed meeting. It will be interesting to see what, if any, impact the WMT news has on the thoughts of FOMC members.
Today’s Morning Lineup discusses earnings news out of Europe and the Americas, the geopolitical impacts of Pelosi’s planned visit to Taiwan, economic data from around the world, and much more.
First, it was Target (TGT) in May, but yesterday it was WMT’s turn to issue a rare earnings warning outside of its regularly scheduled quarterly earnings report. As noted in last night’s Closer, the company noted that “increasing levels of food and fuel inflation are affecting how customers spend, and while we’ve made good progress clearing hardline categories, apparel in Walmart U.S. is requiring more markdown dollars”. In response to the warning, shares of the retailer plunged close to 10%, and if those levels hold into the opening bell, it will be the stock’s largest downside gap since the 1987 Crash. Including today’s decline at the open, today will be WMT’s second downside gap to make the top ten (since 1985) this year. The only other year with two entries on the list is 2020 in the middle of the COVID crash. There weren’t even two declines of similar levels during the Financial Crisis!
Looking at the chart below, it’s amazing to see how strong WMT was in the late 1980s and 1990s only to stall out, relatively speaking, at the turn of the century. Including dividends, WMT stock has had an annualized return of 4.32% from 12/31/99 through the opening bell today compared to the S&P 500’s gain of 6.5% over that same period.
While the largest downside gap since the 1987 crash may seem a bit excessive, keep in mind that as of yesterday’s close (before the warning was released), WMT was only down about 8% YTD and trading at a premium to the S&P 500 as investors viewed it as a port in the storm. At the opening bell today, WMT will be down less than 18% YTD, which is only slightly weaker than the S&P 500, with a valuation much closer to inline with the broader market. In bear markets, there are no ports.

Start a two-week trial to Bespoke Premium to read today’s full Morning Lineup.
Daily Sector Snapshot — 7/25/22
Demand Decimation Out of Dallas
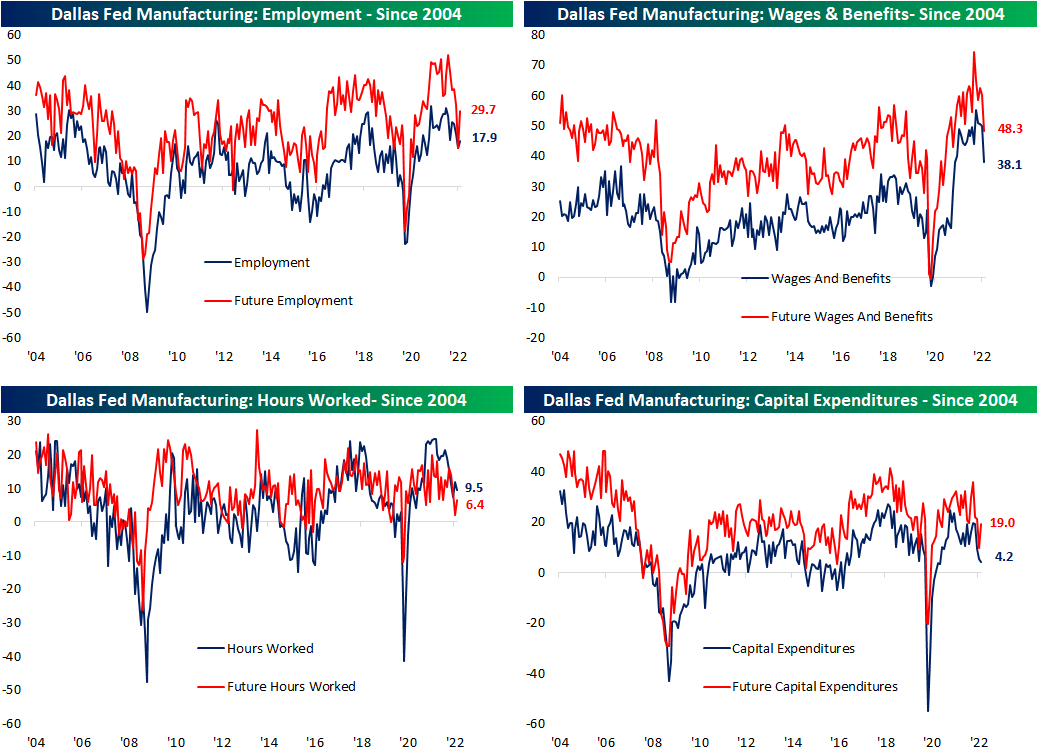
Manufacturing data has continued to cool with the Dallas Fed’s monthly survey showing further deterioration in the month of June. The reading on General Business Outlook dropped another 4.9 points month over month to -22.6; the worst reading since the spring of 2020. Expectations are similarly at some of the lowest levels in over two years, but July did see a modest rebound.

The individual categories of the report were mixed. While most remain in expansionary territory, some of the more important categories like New Orders are in deep contraction. The month-over-month moves were even more mixed as just over half of the components fell. As we have seen across other regional Fed reports recently, expectations broadly sit at much more depressed levels, although July did see some big rebounds across categories.

Even though demand has slowed, production expanded at a slightly accelerated rate in July. At only 3.8, though, the index is in the bottom quartile of its historical range and capacity utilization is only slightly stronger.

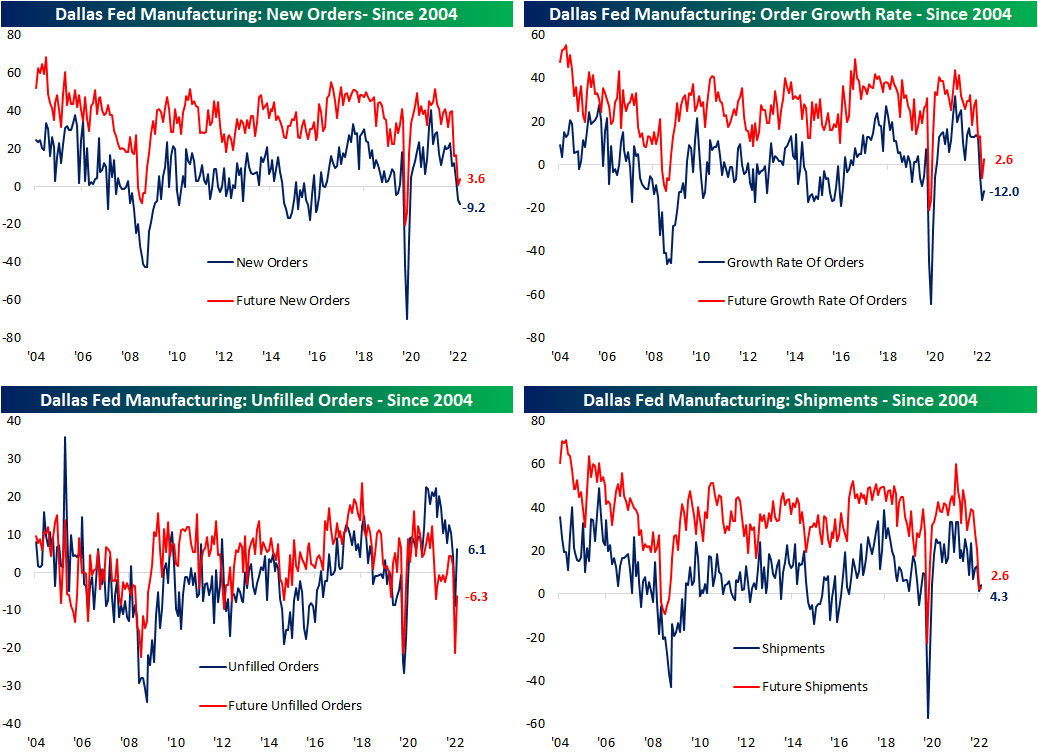
Manufacturers reported the worst slowdown in demand since the spring of 2020 as the index for New Orders fell to -9.2. The 1.9 point sequential decline was actually much smaller than the 10.5 point and 8.9 point declines in June and May, respectively, however that nonetheless expresses demand has been weakening materially. As new demand is a fraction of what it once was, Unfilled Orders experienced a peculiarly large uptick of 14.9 points. That ranks in the top 2% of all monthly moves on record resulting in the index to flip from a historically weak to a more solid reading.
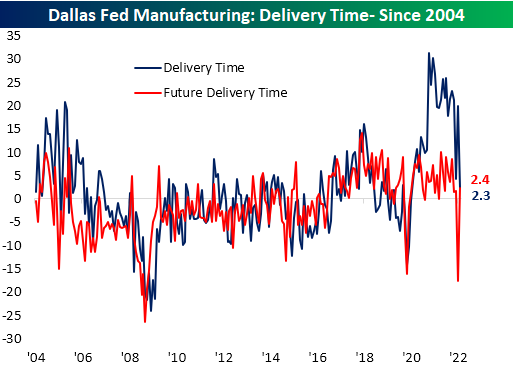
The Dallas Fed report added to the list of indicators pointing to alleviation on the supply chain front as well. The Delivery Times index experienced its second-largest one-month decline on record. Even though that brings the index to a barely expansionary level, the move heavily contrasts with expectations. Future Delivery Times recorded the largest month-over-month gain on record. Given that reading brings the index only to 2.4, it does not mean manufacturers expect delivery times to begin to surge to unprecedented levels as they did earlier in the pandemic. Rather, they no longer expect the rapid improvement that has been observed over the past several months.
As for other metrics that have fallen off a cliff, likely thanks to the easing of supply chain bottlenecks, both Prices Paid and Received are plummeting across both current and future conditions.

In addition to the decline in prices paid and received, the indices tracking the growth of wages and benefits has also been pulling back sharply. Both current conditions and future expectations saw some of their largest one-month declines on record, although, at current levels, they remain more elevated within their historical range than prices paid and received. The employment index peaked well over one year ago, but it has not experienced that same sharp decline as wages in benefits. In fact, there was a modest rise in the reading in July meaning firms increased hiring at an accelerated rate. Contrasting with that higher spending on employment, the capital expenditures index has been consistently grinding lower with this month marking the fourth monthly decline in a row, and at 4.2, it has fallen to the lowest level since October 2020. Click here to learn more about Bespoke’s premium stock market research service.
B.I.G. Tips – Mega-Cap Earnings
Chart(s) of the Day – Downtrends Entrenched But Some Green Shoots
4th Longest Streak of Declines in Prices at the Pump
The price of a gallon of gas, while still up YTD and relative to most other periods in the past, has pulled back considerably and consistently over the last six weeks. While a gallon of gas topped $5 in early to mid-June, over the weekend, the average price was back down to $4.36. The decline in prices has also been consistent as prices have now declined for 41 straight days. Going back to 2005, when AAA began tracking the daily national average price, this current streak now ranks as the fourth-longest on record after surpassing the 39-day streak from September 2006 over the weekend. In order for this current streak to move into the top three and oust the 62-day streak from the COVID crash, we’ll need to see another three weeks of daily declines, and in order to move into first place overall, we’d need to see the current streak nearly triple in length to 118 days and stretch out to early October!

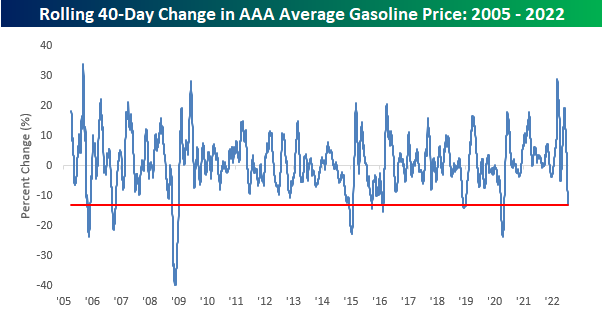
While the current streak of declines is the fourth-longest on record, the magnitude of gasoline’s decline over the last 40 days hasn’t been quite as extreme. At -13%, there have been seven other periods where average prices at the pump experienced a larger decline over the same time period. What is notable, however, is that back in March the 40-day rate of change was the second highest on record trailing only the 33% increase that came in the wake of Hurricane Katrina in September 2005.
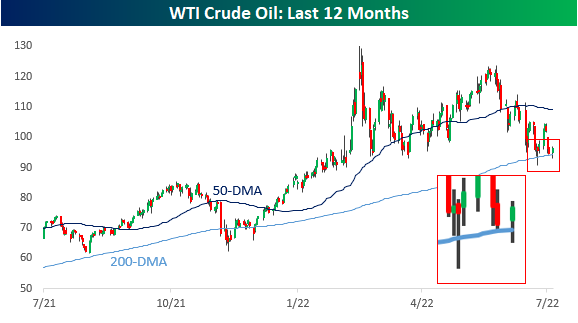
In order for prices at the pump to keep declining, we’re going to need oil prices either to stay around current levels or continue declining. Oil prices have obviously been weak for the last month or so, but over the last two weeks have shown some stabilization above the 200-DMA, including two different days when the price dropped below the 200-DMA intraday but bounced. If the 200-DMA holds in the near-term, gas prices are likely to stop declining, so this will be a key level to watch for what will ultimately determine the health of the consumer. Click here to learn more about Bespoke’s premium stock market research service.