Bespoke’s Morning Lineup – 2/14/23 – CPI Loves Me, CPI Loves Me Not
See what’s driving market performance around the world in today’s Morning Lineup. Bespoke’s Morning Lineup is the best way to start your trading day. Read it now by starting a two-week trial to Bespoke Premium. CLICK HERE to learn more and start your trial.
“Today is Valentine’s Day — or, as men like to call it, Extortion Day!” – Jay Leno

Below is a snippet of content from today’s Morning Lineup for Bespoke Premium members. Start a two-week trial to Bespoke Premium now to access the full report.
Given the lack of major economic data last week, investors have had their sights set on the January jobs report ever since the January employment report earlier in the month. Well, the day is finally here. The consensus was for an acceleration from December’s rate, which was a decline of 0.1%. The 9% surge in gas prices during January alone would suggest an increase of 0.5%, which coincidentally is right where consensus forecasts had settled heading into the report. It’s also exactly where the report came in. Ex Food and Energy, the reading came in at 0.4% which was also right in line with forecasts. The only issue was the y/y readings which both also came in higher than expected.
While a 0.5% m/m increase is red meat for the headline writers to paint a narrative of inflation starting a new leg higher, the fact that it’s also right where consensus expectations are means that it was priced into the report. Also, with interest rates rising leading up to the report last week, one could argue that many investors were gearing up for an even stronger number. The market reaction so far has been indecisive. After originally erasing all of the pre-market gains, futures rebounded back above where they were heading into the report, and have now once again erased those gains. All in the span of nine minutes! Interest rates have been moving in the opposite direction. CPI loves me, CPI loves me not.
As far as the market is concerned, CPI reports have taken on an added significance in the last year as we have seen heightened volatility on CPI days. Over the last year, the S&P 500’s average daily move on CPI days has been a gain or loss of 1.94%, which is a level of volatility last seen back during the financial crisis. As shown in the chart below, there’s been a shift within the trend of volatility, though. From February to July of last year, the S&P 500 declined on CPI days for six straight months and was down for seven out of eight straight months from February to September. Since October, though, there have been four straight months where the S&P 500 rallied on CPI days. Not only that, but the degree of volatility is also showing what could be an early sign of abatement as there have been two months in a row where the one-day change on a CPI day was less than 1%.

Our Morning Lineup keeps readers on top of earnings data, economic news, global headlines, and market internals. We’re biased (of course!), but we think it’s the best and most helpful pre-market report in existence!
Start a two-week trial to Bespoke Premium to read today’s full Morning Lineup.
Daily Sector Snapshot — 2/13/23
Chart of the Day: Better Inflation, Better Responses
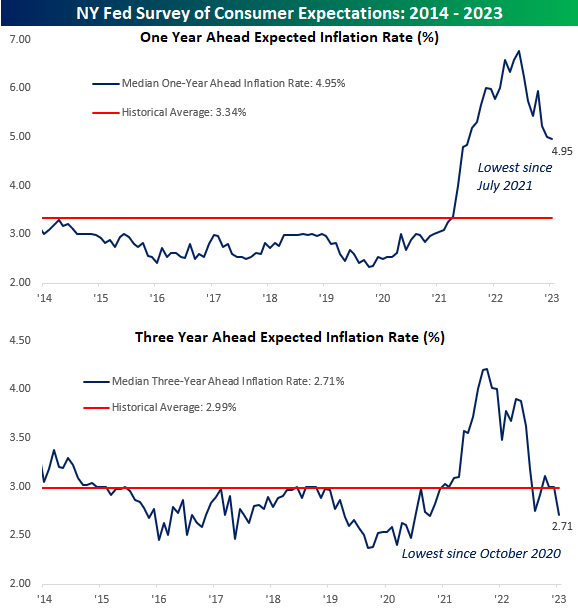
Inflation Expectations Trending Lower
The monthly survey of consumer expectations from the New York Federal Reserve was released this morning and showed that ahead of January’s CPI report on Tuesday, consumer expectations towards inflation are generally stable and trending lower. On a one-year basis, inflation expectations dropped ever so marginally falling from 4.99% down to 4.95%. Three-year inflation expectations dropped from 2.99% down to 2.71%, and the only increase was in five-year expectations which increased from 2.4% to 2.5%.
Regarding expectations for the next five years, it’s hard to read too much into the trend since the NY Fed has only been surveying consumers on this time frame for a year. For the one and three-year time frames, however, we have close to 10 years worth of monthly responses so we can get a better read on how things stand now versus the past. Starting with expectations for the next year, consumers expect inflation to continue to trend lower from the peak of 6.78% last June, and at the current level of 4.95%, they’re at the lowest level since July 2021 even as they remain well above the historical average of 3.34%.
Inflation expectations for the next three years are more interesting. While expectations peaked at 4.21% in October 2021, January’s reading came in at 2.71%, which was the lowest since October 2020, but more importantly, below the historical average of 2.99%. In other words, consumers expect less inflation over the next three years than they have across the majority of other times in the last ten years. See more analysis of economic data with a Bespoke Premium membership. Click here to sign up for a two-week trial today.
New 52-Week Highs in 2023
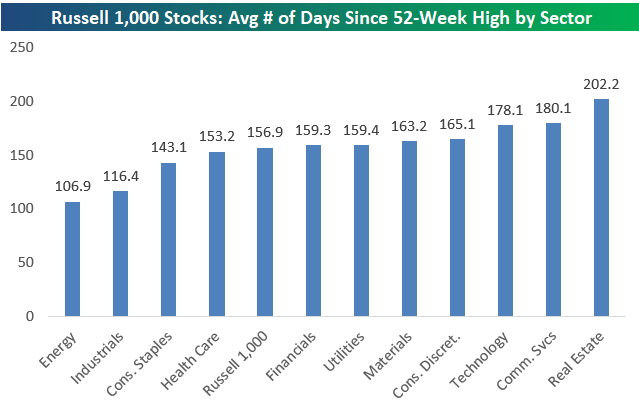
20% of stocks in the large-cap Russell 1,000 have made 52-week highs at some point so far in 2023. However, about 23% of stocks in the index made their last 52-week highs in February 2022. Across the entire index, the average stock made its last 52-week high 156.9 days ago. Real Estate stocks made their 52-week highs an average of 202.2 days ago, the furthest back of any sector, while Energy stocks on average made their 52-week highs 106.9 days ago (the most recent of any sector).
Below is a list of Russell 1,000 stocks with market caps above $50 billion that have made new 52-week highs at some point in 2023. Of the 28 stocks that made the list, there’s representation from eight of eleven sectors. That’s pretty spread out. The only sectors that aren’t represented are Materials, Real Estate, and Utilities. Health Care, Industrials, and Technology each have six stocks that made the list. The largest stocks include names like Exxon Mobil (XOM), Eli Lilly (LLY), Merck (MRK), Mastercard (MA), Oracle (ORCL), and Visa (V). You can monitor the daily list of new 52-week highs in our Tools section with a new Bespoke Premium membership. Click here to sign up for a two-week trial today.

Bespoke’s Morning Lineup – 2/13/23 – Tough Times For Defense
See what’s driving market performance around the world in today’s Morning Lineup. Bespoke’s Morning Lineup is the best way to start your trading day. Read it now by starting a two-week trial to Bespoke Premium. CLICK HERE to learn more and start your trial.
“When it’s grim, be the Grim Reaper and go get it.” – Andy Reid
Below is a snippet of content from today’s Morning Lineup for Bespoke Premium members. Start a two-week trial to Bespoke Premium now to access the full report.
If you were thinking that there was something familiar about the market last week, you weren’t going crazy. With Communications Services (-5.57%) and Consumer Discretionary (-2.11%) leading the way to the downside and Energy (+4.94%) leading to the upside, it was basically a replay of 2022. Although last week also reflected a fair amount of mean reversion from the YTD moves of 2023, there’s still a good amount of dispersion in the market as six sectors finished the week at overbought levels, three were oversold and just two were neutral. With the oversold camp comprised of Consumer Staples, Health Care, and Utilities, it hasn’t been an especially strong showing for defensive sectors which is something that the defenses of both the Chiefs and Eagles can empathize with. It was such a poor showing for both defenses last night, in fact, that the total of 73 points was the third-highest total of any game, and it was the first time that both teams scored 35 points or more.
Look on the bright side, though, in the ten prior Super Bowls where the total was 60 or more, the S&P 500’s rest of year performance was a gain of 11.7% with positive returns nine out of ten times. The only exception was Super Bowl LII when the Eagles took out the Patriots 41-33 in what was the second-highest-scoring Super Bowl of all time.

Our Morning Lineup keeps readers on top of earnings data, economic news, global headlines, and market internals. We’re biased (of course!), but we think it’s the best and most helpful pre-market report in existence!
Start a two-week trial to Bespoke Premium to read today’s full Morning Lineup.
Bespoke Brunch Reads: 2/12/23
Welcome to Bespoke Brunch Reads — a linkfest of the favorite things we read over the past week. The links are mostly market related, but there are some other interesting subjects covered as well. We hope you enjoy the food for thought as a supplement to the research we provide you during the week.
While you’re here, join Bespoke Premium with a 30-day trial!
Frauds
The Great Gatsby of Gold Took Their Millions—and Vanished by Emily Shugerman (The Daily Beast)
An investment manager who promised investors that he would shepherd their savings via physical precious metals certificates ended up absconding with millions in client assets. [Link]
Commodity Trader Trafigura Faces $577 Million Loss After Uncovering Nickel Fraud by Archie Hunter and Jack Farchy (Bloomberg)
One of the world’s largest metals traders may have bought bogus nickel by the hundreds of millions. The metal is a favorite for fraudsters because of relatively high value-weight ratios but less scrutiny and security than precious metals. [Link; soft paywall, auto-playing video]
‘Sam? Are you there?!’ The bizarre and brutal final hours of FTX by Joshua Olver (FT)
A detailed look at leadership of the crypto trading giant as its entire business model evaporated over the course of a couple days last fall, leading to frantic calls trying to borrow billions in order to meet client redemptions. [Link; paywall]
Platform Demise
Elon Musk fires a top Twitter engineer over his declining view count by Zoë Schiffer and Casey Newton (Platformer)
When engineers tried to explain to the irate CEO of Twitter that people might be losing interest in his whole narrative (as opposed to his own tweets’ reach being suppressed by the company’s algorithm) one was fired. There are now only two principal engineers left at the company. [Link]
Tiktok’s enshittification by Cory Doctorow (Pluralistic)
As platforms grow, they stop optimizing for users and start optimizing for advertisers and other paying customers, creating negative feedback loops of bad experiences which eventually doom the audiences advertisers are trying to access. [Link]
Big Mistakes
‘As bad as it gets without body bags.’ by James Fallows (Breaking The News)
Some background on a harrowing incident at Austin’s airport which would likely have led to a disastrous mid-air collision if not for some quick thinking by a very attentive FedEx flight crew. [Link]
Your jailbroken ChatGPT might violate OpenAI’s safety guidelines when role-playing as ‘DAN’ by Clint Rainey (Fast Company)
OpenAI has built guardrails into its popular ChatGPT chatbot, but a set of instructions posted on Reddit appear to show how to get around the restraints that have been placed on the AI system by its creators. [Link]
Government Chaos
A single Republican holdout doomed the GOP’s ‘skinny budget’ on Monday by Jerod Macdonald-Evoy (AZ Mirror)
A single Republican state House legislator in Arizona is preventing the passage of a budget until the 2022 election can be re-done as she claims that the election was rigged. With a one vote majority, that means the state is faced with a difficult path to keeping government operating. [Link]
Moldova’s Pro-Western Government Collapses as Fallout From Ukraine War Worsens by James Hookway (WSJ)
The small neighbor to Ukraine, which has also been put under pressure by Russia, saw its pro-EU government resign this week after a brutal series of economic shocks related to the war in Ukraine. [Link; paywall]
Fungus
Fungal infections are becoming more common. Why isn’t there a vaccine? by Berkeley Lovelace Jr (CNBC)
While fungal infections are less of a threat than bacteria or viruses, a warmer planet is making them more common with some fungal infections untreatable. But no vaccine currently exists. [Link]
Texas
How the Crispy Dog Became San Antonio’s Signature Snack by José R. Ralat (Texas Monthly)
A cheese-stuffed dog fried in a tortilla shell is a famed snack for San Antonians, but the demise of small family restaurants that popularized the treat is making it harder to find in the city. [Link]
Investing
The Retreat of the Amateur Investors by Gunjan Banerji (WSJ)
First-time investors went from near-overnight millionaires thanks to free-to-trade apps and lots of leverage to working in delis after a year-long bear market that hit momentum and growth plays especially hard. [Link; paywall]
Real Estate
Boomer Dads Are Driving Real-Estate Agents Nuts by Adriane Quinlan (Curbed)
Millennials are relying on their parents for advice buying homes as well as funding, which has Boomer Dads more involved in real estate transactions than has historically been the case. Realtors, at least, are not fans of this arrangement. [Link]
Superbowl
Patrick Mahomes Is the NFL’s Half-Billion Dollar Quarterback. He’s Still a Bargain. by Andrew Beaton (WSJ)
While a half-billion dollar contract may sound impossible to live up to, the Kansas City Chiefs’ Patrick Mahomes has turned out to be worth much more than the Chiefs pay him. [Link; paywall]
Read Bespoke’s most actionable market research by joining Bespoke Premium today! Get started here.
Have a great weekend!
The Bespoke Report – 2/10/23 – Flesh Wound
This week’s Bespoke Report newsletter is now available for members. (Log in here if you’re already a subscriber.)
While the market is still right in the thick of earnings season, it was a quiet week in terms of news and macro data. After the deluge of both earnings reports and economic data to kick off February, and ahead of next week’s busy slate, investors could use a break. With the vacuum of info, though, investors chose to focus on the looming inflation report next week and expectations for a big jump relative to December’s deflationary reading. Based on the surge in rates, especially at the short end of the curve, investors are bracing for a hot number.
View this week’s Bespoke Report newsletter by starting a one-month trial, or click the image below to view our membership options page.

Daily Sector Snapshot — 2/10/23
B.I.G. Tips – Death by Amazon – 2/10/23
In this note we update performance of our “Death By Amazon” and “Amazon Survivors” indices. The index of stocks that are exposed to Amazon’s business model have traded more or less in lock step with the market over the past two years. That’s a big contrast with the prior decade when they either outperformed or underperformed pretty dramatically.
The same can’t be said for our “Amazon Survivors” names which are intended to capture stocks which are resilient to the rise of Amazon’s monster e-commerce business despite competing with it. This index has generally outperformed the market as a whole.
Both flavors of index have outperformed Amazon significantly over the past five months or so. During that period, the market has broadly rallied even though large tech names like Amazon have sunk to the lowest levels of the equity bear market.
Our “Death By Amazon” index was created many years ago to provide investors with a list of retailers we view as vulnerable to competition from e-commerce. In 2016, we also created our “Amazon Survivors” index which is made up of companies that look more capable of dealing with the threat from online shopping. To see how the two indices have been performing lately and view the full list of stocks that make up the indices, please read our newest report on the subject available to Bespoke Premium and Bespoke Institutional members.
To unlock our “Death By Amazon” and “Amazon Survivors” indices, login or start a two-week free trial to either Bespoke Premium or Bespoke Institutional.
