Daily Sector Snapshot — 5/9/23
B.I.G. Tips — 2011 Was Different
Chart of the Day – Housing Market Hotness
Bespoke Stock Scores — 5/9/23
Bespoke’s Morning Lineup – 5/9/23 – Less Confidence
See what’s driving market performance around the world in today’s Morning Lineup. Bespoke’s Morning Lineup is the best way to start your trading day. Read it now by starting a two-week trial to Bespoke Premium. CLICK HERE to learn more and start your trial.
“No one knows what interest rate the market would set, it’s always being manipulated.” – William Dunkelberg, NFIB

Below is a snippet of content from today’s Morning Lineup for Bespoke Premium members. Start a two-week trial to Bespoke Premium now to access the full report.
After Friday’s surge didn’t have much in the way of follow-through yesterday, bears have the upper hand this morning as futures are decidedly weaker, and treasury yields are lower (although they’re pretty much exactly where they were at this point yesterday morning). Investors will also be looking ahead to this afternoon’s meeting between the President and leaders of Congress over the debt ceiling. Expectations are low, but you never know. The fact that the President and his advisers are willing to meet after already saying they wouldn’t negotiate, is a small sliver of hope.
The performance of individual stocks grouped by market cap has been interesting to watch this year and for now, has laid to waste the notion that big things come in small packages. The chart below summarizes the average YTD performance of stocks in various major US indices, and while it may look at first like it’s sorted left to right from best to worst, it’s actually by the market cap of stocks that each index represents from largest to smallest. On the left, are the Nasdaq 100 and S&P 100 which are comprised of US mega-caps. The average YTD performance of Nasdaq 100 stocks has been a gain of 11.45% while the 100 components of the S&P 100 are up an average of 4.93% YTD. Broadening out a little bit to the large-cap S&P 500, the average YTD return of those stocks has been a gain of 2.58%.
Stepping down the market cap ladder from large caps, the average YTD return of mid-cap stocks in the S&P 400 has been a gain of 2.13%. Finally, at the bottom rungs, we have small and microcap stocks which are the only two of the six indices shown where the average YTD return is negative (-1.89% for stocks in the S&P 600 and -0.28% for stocks in the Russell Microcap index). It’s at these last two indices where the progression of performance getting incrementally weaker also breaks down.

Given its outperformance YTD, it shouldn’t come as a surprise that the Nasdaq 100 is closer to a 52-week high than any of its peers. The index has essentially been rangebound since a breakout on March 31, but after last Friday’s surge and Monday’s follow-through, it’s making its best effort to break out again. Based on where futures are trading this morning, it doesn’t look like it’s going to happen today, but a lot can change over the course of a few hours, and Wednesday’s CPI will most certainly have a say in how things play out.

Start a two-week trial to Bespoke Premium to read today’s full Morning Lineup.
The Triple Play Report — 5/9/23
An earnings triple play is a stock that reports earnings and manages to 1) beat analyst EPS estimates, 2) beat analyst sales estimates, and 3) raise forward guidance. You can read more about “triple plays” at Investopedia.com where they’ve given Bespoke credit for popularizing the term. We like triple plays as an indication that a company’s business is firing on all cylinders, with above-expectations results and an improving outlook. A triple play is indicative of positive “fundamental momentum” instead of pure fundamentals, and there are always plenty of names with both high and low valuations on our quarterly list.
Bespoke’s Triple Play Report highlights companies that have recently reported earnings triple plays, and it features commentary from management on triple-play conference calls, company descriptions and analysis, and price charts. Bespoke’s Triple Play Report is available at the Bespoke Institutional level only. You can sign up for Bespoke Institutional now and receive a 14-day trial to read this week’s Triple Play Report, which features seven stocks. To sign up, choose either the monthly or annual checkout link below:
Bespoke Institutional – Monthly Payment Plan
Bespoke Institutional – Annual Payment Plan

One of the sixteen triple plays featured in our newest report is Manhattan Associates (MANH). MANH has definitely been one of the most consistent reporter of triple plays over the last few years, and its share price is now just 8% below its late 2021 all-time highs after rallying just over 50% from its lows last November.

Manhattan Associates provides software solutions and services to help businesses optimize their supply chain, inventory, and omnichannel operations. Their products include tools for warehouse management, transportation management, order management, and customer engagement, among others. This name has tailwinds as both an infrastructure and an “automation” play. As shown below in the snapshot for MANH in our Earnings Explorer, revenues have re-accelerated to new highs in the last couple of years, even through last year’s bear market for stocks.
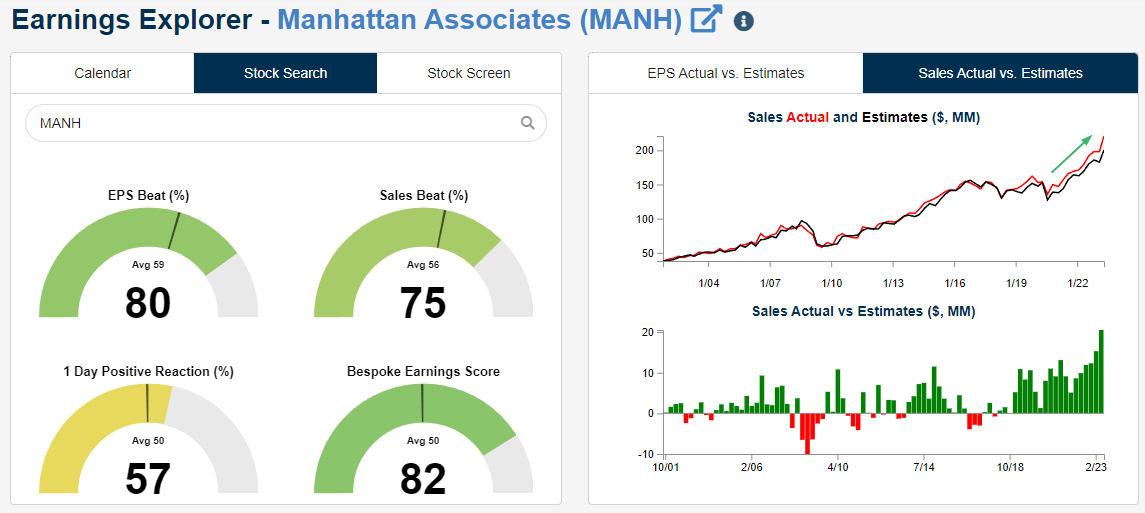
In terms of triple plays, MANH has now reported five in a row and 11 in its last 17 earnings reports, with EPS and revenue beats 17 quarters in a row as well.

For a full analysis of all 16 Tech-sector triple plays featured in this report, simply sign up for a Bespoke Institutional trial today and then read on!
Bespoke Investment Group, LLC believes all information contained in these reports to be accurate, but we do not guarantee its accuracy. None of the information in these reports or any opinions expressed constitutes a solicitation of the purchase or sale of any securities or commodities. This is not personalized advice. Investors should do their own research and/or work with an investment professional when making portfolio decisions. As always, past performance of any investment is not a guarantee of future results. Bespoke representatives or clients may have positions in securities discussed or mentioned in its published content.
Daily Sector Snapshot — 5/8/23
Megacaps Still Carrying Their Weight
Heading into earnings season, there was a considerable amount of angst on the part of investors regarding the mecacap stocks and how they would react to their earnings reports. Given their outperformance in Q1, the prevailing view was that the bar was too high, leaving the megacaps susceptible to disappointment when they reported. Within the S&P 500, there are seven companies whose weighting exceeds 1.5% in the index, and in the chart below we list the performance of each company’s stock (largest to smallest) on the earnings reaction day of their most recent report. Of the seven companies highlighted, only two (Alphabet and Amazon.com) declined in reaction to their reports. Two stocks (Nvidia and Meta) surged more than 10%, one (Microsoft) rallied more than 7%, and Apple, with its weighting of over 7%, managed to rise more than 4.5% following its report last week. There’s still a ton of reports left to get through before earnings season winds down, but on a market cap basis, we’re past the peak, and based on the reactions of the largest companies in the market, it’s been a much better earnings season than most investors expected.

Have you tried Bespoke All Access yet?
Bespoke’s All Access research package is quick-hitting, actionable, and easily digestible. Bespoke’s unique data points and analysis help investors better visualize underlying market trends to ultimately make more informed investment decisions.
Our daily research consists of a pre-market note, a post-market note, and our Chart of the Day. These three daily reports are supplemented with additional research pieces covering ETFs and asset allocation trends, global macro analysis, earnings and conference call analysis, market breadth and internals, economic indicator databases, growth and dividend income stock baskets, and unique interactive trading tools.
Click here to sign up for a one-month trial to Bespoke All Access, or you can read even more about Bespoke All Access here.

Chart of the Day: Raising Staples
Bespoke’s Morning Lineup – 5/8/23 – Candy Apple
See what’s driving market performance around the world in today’s Morning Lineup. Bespoke’s Morning Lineup is the best way to start your trading day. Read it now by starting a two-week trial to Bespoke Premium. CLICK HERE to learn more and start your trial.
“If you know the edge of your own ability pretty well, you should ignore most of the notions of our experts about what I call ‘deworsification’ of portfolios.” – Charlie Munger
Below is a snippet of content from today’s Morning Lineup for Bespoke Premium members. Start a two-week trial to Bespoke Premium now to access the full report.
While the S&P 500 was still down for the week, last Friday’s rally did a lot to boost sentiment as it turned a hole of over 2.5% to a weekly decline of less than 1%. For its part, the Nasdaq actually managed to finish the week marginally higher. This morning, the week is starting off on a relatively quiet but positive note as the economic calendar is light, and the pace of earnings slow. Thankfully, there wasn’t even any stress in the banking sector to have to contend with! Looking ahead, though, earnings activity will pick up after the close, and even though the mega-caps are behind us, we’re still in the peak reporting period, so the number of reports won’t slow down. Then, on Wednesday, the April CPI will likely be the major report of the week, and that will likely dictate how we finish the week.
Over the weekend at the annual Berkshire Hathaway shareholders meeting, Warren Buffett referred to Apple (AAPL) as a better business ‘than any we own’. Apple has worked out better than See’s Peanut Brittle for Berkshire shareholders. The chart below shows the quarterly performance of Berkshire Hathaway (BRK/b) over the last 20 years. From 2003 through the end of 2015, before Berkshire started acquiring Apple, the stock’s average quarterly return was a gain of 2.3%. Since 2016, when Buffett first took a bite out of Apple, Berkshire’s average quarterly gain has been more than a full percentage point higher at 3.4%.
Now, to say that the higher average quarterly return is due entirely to Apple would be too simplistic. After all, S&P 500 returns are higher in the post-2016 period (+2.8%) compared to the period from 2003 through the end of 2015 (+2.3%) but given AAPL’s outperformance of the overall market since the start of 2016 (144%) it certainly hasn’t hurt Berkshire, and the stock would almost certainly be lower now had Buffett not placed the bet on Tim Cook.

Not surprisingly, as Apple has become a much larger part of Berkshire, the stock has tended to trade more in line with Apple as well. The chart below shows the rolling 200-day correlation between the daily percentage changes of Apple and Berkshire over the last 20 years. From 2003 through the end of 2015, the average rolling correlation between the two was +0.256. Since Berkshire started acquiring Apple, even though the correlation immediately dipped in early 2016, the overall average correlation has been considerably higher at +0.453.

Start a two-week trial to Bespoke Premium to read today’s full Morning Lineup.