Chart of the Day: CPI Coming Up
Lucky Seven for the Nasdaq
It wasn’t by much, but the Nasdaq rallied 0.14% last week and extended its streak of weekly gains to seven. That’s the longest streak of weekly gains for the index since November 2019. To find a longer streak, you have to go back to February 2018 when the Nasdaq had ten straight weeks of gains. As shown in the chart below, since the Financial Crisis lows in May 2019, there have now been seven different periods where the Nasdaq rallied for at least seven weeks in the row.

The chart below shows the performance of the Nasdaq since the start of 2009, and we have included red dots to show each time the Nasdaq was up for seven straight weeks (for each period, the dot represents the Friday of the seventh positive week). While there were two periods (2010 and 2012) where the Nasdaq clearly experienced a moderate pullback fairly quickly after its seventh positive week, following the others, it doesn’t appear as though the rally was tripped up at all.

Looking at forward performance after a seven-week winning streak in more detail, the chart below shows the maximum drawdown for the S&P 500 in the three months after seven straight weeks of gains in the Nasdaq. Here again, it’s easy to see the large declines that followed the 2010 and 2012 streaks, but in the four other streaks, the S&P 500 never even pulled back 4%. In two of those periods, the maximum decline never exceeded 0.41%. For reference, the average ‘max drawdown’ over any three-month period for the Nasdaq since the start of 2009 has been 5.33%

Have you tried Bespoke All Access yet?
Bespoke’s All Access research package is quick-hitting, actionable, and easily digestible. Bespoke’s unique data points and analysis help investors better visualize underlying market trends to ultimately make more informed investment decisions.
Our daily research consists of a pre-market note, a post-market note, and our Chart of the Day. These three daily reports are supplemented with additional research pieces covering ETFs and asset allocation trends, global macro analysis, earnings and conference call analysis, market breadth and internals, economic indicator databases, growth and dividend income stock baskets, and unique interactive trading tools.
Click here to sign up for a one-month trial to Bespoke All Access, or you can read even more about Bespoke All Access here.

Bespoke’s Morning Lineup – 6/12/23 – A New and Much Different Week
See what’s driving market performance around the world in today’s Morning Lineup. Bespoke’s Morning Lineup is the best way to start your trading day. Read it now by starting a two-week trial to Bespoke Premium. CLICK HERE to learn more and start your trial.
“That wall has to come down. That’s what I’d like to say to them.” – Ronald Reagan

Below is a snippet of content from today’s Morning Lineup for Bespoke Premium members. Start a two-week trial to Bespoke Premium now to access the full report.
Continuing the trend from last week and the last several months for that matter, equity futures are indicated higher this morning with the Nasdaq leading the way. The S&P 500’s bull market was confirmed last Thursday when it closed 20%+ from its October 12th low, but it will quickly face a big test this week with important inflation data and a Fed meeting culminating on Wednesday.
There hasn’t been a whole lot of economic data overnight in Asia or Europe, but Japan did report a larger-than-expected decline in PPI, and Machinery Tool Orders were down over 22% y/y in May after falling 14.4% in April. With data suggesting slower economic activity than expected, treasury yields are lower with the biggest moves at the short end of the curve, and crude oil is back under $70 per barrel to $68.43.
Barring an epic collapse in stock prices today, the S&P 500 will have gone eight months without hitting a new low after falling 20% or more from a 52-week high. We discussed how this period compares to prior periods and how the market performed going forward in this weekend’s Bespoke Report, but the chart below compares the S&P 500’s performance in the eight months coming off October’s lows to the eight months that followed each of the prior lows.
With a gain of 20.2%, the S&P 500 just barely moved into official bull market territory last week and avoided being just the third period (along with 1947 and 1957) of the fourteen in which the S&P 500 did not reach the 20% threshold for a bull market in the first eight months of a rally off the lows. You’ll see in the chart that the S&P 500 was also up less than 20% eight months after the September 2001 low, but in that period, it had already rallied 20% and was in a new bear market once the eight-month anniversary of the September low occurred. While the S&P 500 managed to make it into bull market territory last week, its gain in the first eight months of the rally is just over ten percentage points weaker than the average for all fourteen prior periods which helps to explain why, if you don’t have exposure to Technology and Communication Services, it may not exactly feel like a bull market.

Start a two-week trial to Bespoke Premium to read today’s full Morning Lineup.
Bespoke’s Brunch Reads – 6/11/23
Welcome to Bespoke Brunch Reads — a linkfest of the favorite things we read over the past week. The links are mostly market-related, but there are some other interesting subjects covered as well. We hope you enjoy the food for thought as a supplement to the research we provide you during the week.
While you’re here, join Bespoke Premium with a 30-day trial!
Technology and Science
Why AI Will Save the World (Andreessen Horowitz)
Typical with the new and relatively unknown, there is certainly fear surrounding AI and its potential capabilities. Andreessen discusses what AI is and is not by giving historical context and providing examples that illustrate how the technology can improve quality of life for everyone. Furthermore, he assesses a list of risks commonly associated with AI and argues why the thinking is flawed. [Link]
As AI-Enabled Cheating Roils Colleges, Professors Turn to an Ancient Testing Method (WSJ)
Cheating remains a critical issue for colleges and universities, particularly due to the rise of AI and its ease of use in written exams and other online assignments. To avoid degrees losing their value because of illegitimate grades, professors are turning back towards oral exams. Yes, oral exams combat the rise in cheating and use of AI, but professors have found several other benefits in the exam format. [Link]
Retailers are gamifying shopping with virtual storefronts to boost engagement, loyalty (CNBC)
Amongst several other big retail names, J. Crew is the latest to launch a virtually immersive shopping experience for its 40th anniversary. Obsess is behind the project, a platform that creates 3D, virtual stores. J. Crew’s virtual beach house is expected to boost engagement in the company’s products and therefore its checkout rate, as seen in several other brands Obsess works with. [Link]
Urban Decay
Owner of San Francisco’s largest hotels not paying property loan, plans to exit the city (MSN)
The city of San Francisco faces some serious issues, and ones that business executives like CEO of Park Hotels and Resorts Thomas J. Baltimore Jr. have decided to step away from completely as they close doors. Among these issues are street conditions, record high office vacancies, and an overall slow pandemic recovery. The Bay Area Council is hopeful that AI and other industries can help the city make a comeback. [Link]
NYC sues Hyundai for negligence in wake of TikTok car thefts (Engadget)
Following a viral car theft TikTok trend that started in 2022, dubbed the “Kia Challenge,” Hyundai has agreed to pay $200 million to settle a class action lawsuit. The trend exposed the automaker for what New York City called “sacrificing public safety for profits,” referring to the market-specific choice to not install common anti-theft tech in certain US models. [Link]
Bill to stop employees confronting shoplifters passed by California Senate (Newsweek)
California passed controversial legislation banning employees from stopping thieves. In the weeks leading up to the bill, a Home Depot security guard was shot during an attempted robbery while Lululemon CEO Calvin McDonald has been criticized for firing employees who attempted to stop thieves. Many oppose the legislation, suggesting that it serves as an open invitation to “come in and steal.” [Link]
Economy
West Coast dockworkers making $200K demand higher pay (FreightWaves)
The International Longshore and Warehouse Union is demanding higher wages and benefits for dockworkers, citing the COVID-era import boom that has resulted in the decrease in wages as a share of revenues. The argument against them: these workers are already some of the highest paid in the country. [Link]
What All the Single Ladies (and Men) Say About the Economy (NYT)
Signet Jewelers shared a new metric to express impact of the COVID-19: sale of engagement rings. The company said it has sold fewer this year in comparison to their usual levels, pointing to the idea that singles in lockdown during the pandemic were disrupted in terms of their dating lives. Moreover, consumers are also feeling economic pressures in the current environment, pushing them away from the purchase of these rings. [Link]
Work From Home
Martha Stewart says America will ‘go down the drain’ if people don’t return to office (CNN)
The famous TV personality says hybrid work culture isn’t nearly as productive and in office, and warns that America could “go down the drain” if people don’t get back to in person work. [Link]
To fill offices, Google issues ultimatum while Salesforce tries charity (Washington Post)
Since the pandemic, the structure of work has changed. Executives are now fighting to get employees who have grown fond of their flexible work-from-home lifestyles back in the office. Google has told employees that lack of attendance could negatively impact their performance reviews while Salesforce is trying a different tactic, offering to donate to charities for each day their employees come to the office. Corporate America continues to grapple with this issue despite the pandemic being in the rear-view mirror. [Link]
Geo Politics
Serbia backs ammunition shipments to Ukraine in westward pivot (Financial Times)
The president of Serbia said he is not opposed to selling ammunition to parties who then go on to sell it to forces in Ukraine indicating that Russia may be losing an ally in the region. The Serbian president also noted that he no longer speaks to Putin once every three months and hasn’t spoken to the Russian President in over a year. [Link]
Markets
Binance lawyers allege SEC Chair Gensler offered to serve as advisor to crypto company in 2019 (CNBC)
Before becoming the SEC Chair in 2021, Gary Gensler was teaching at MIT when he offered to serve as an advisor to Binance’s parent company. Since becoming SEC Chair, he has cracked down on crypto, suing companies for allegedly selling unregistered securities. [Link]
ETF Providers Rush to Tap Into AI Investing Craze (WSJ)
With all the frenzy surrounding AI, ETF providers are looking to cash in. The ten funds tracked by ETF.com with artificial intelligence in their names have all recorded inflows this year. The interest in AI investing has also increased demand for single-stock ETFs that track Nvidia (NVDA). [Link]
Read Bespoke’s most actionable market research by joining Bespoke Premium today! Get started here.
Have a great weekend!
Daily Sector Snapshot — 6/9/23
The Bespoke Report – 6/9/23 – Dull is Good
This week’s Bespoke Report newsletter is now available for members. (Log in here if you’re already a subscriber.)

Continue reading this week’s Bespoke Report newsletter by starting a one-month trial, or click the image below to view our membership options page.

Bespoke’s Morning Lineup – 6/9/23 – “Test of the Champion”
See what’s driving market performance around the world in today’s Morning Lineup. Bespoke’s Morning Lineup is the best way to start your trading day. Read it now by starting a two-week trial to Bespoke Premium. CLICK HERE to learn more and start your trial.
“It wasn’t the money, it was just that we had them on the run and gave in. They knew it, and that’s why they wanted to come to terms.” – Al Davis
Below is a snippet of content from today’s Morning Lineup for Bespoke Premium members. Start a two-week trial to Bespoke Premium now to access the full report.
This weekend marks the 155th running of the Belmont Stakes, which is referred to as the “Test of the Champion” given it is the longest and most grueling of the Triple Crown legs. In many ways, the current bull market, which was confirmed yesterday with the S&P 500 closing 20% (barely) above its October 12th low, has been the Belmont Stakes of rallies off a bear market low. To find a period where it took longer for the S&P 500 to rally 20%+ off a bear market low, you have to go back to the late 1950s. The road may have been long, but it’s better than making new lows!
This morning looks like a continuation of the trend all week where there has been little news in terms of earnings and the economy, and futures are modestly lower. Enjoy the calm while it lasts, though, because next week will be another busy week for economic data and even a Fed rate decision to boot.
Megacap stocks may have taken a back seat to large caps in the last several trading days, but somebody forgot to tell Tesla (TSLA). Heading into today, the stock is riding a 10-day winning streak, and with shares up 5% in the pre-market, the streak looks likely to reach Spinal Tap levels today. TSLA has been a wild stock over the years, but in its history as a public company, the stock has only had two other double-digit winning streaks. The first was ten trading days ending in April 2020 while the second came less than a year later when the stock rallied for eleven straight trading days. A gain today would move the current streak into a tie for the longest on record.

The log chart below of TSLA since its IPO shows where each of the prior 10-day winning streaks occurred. The April 2020 streak marked the beginning of what was a massive post-COVID rally where the stock rallied an additional 191% over the next six months. Following the January 2021 streak, however, the stock went on to fall 21% over the next six months.

While TSLA is currently in the midst of one of its longest-ever winning streaks, the magnitude of the move during the last ten days has been less monumental. While 28.4% over ten trading days is nothing to push your plate away over, as recently as this past February, the stock rallied more than 48% over ten trading days, and since November 2021, there have been three other ten-day periods where the stock rallied as much or more than it has over the last ten trading days.

Start a two-week trial to Bespoke Premium to read today’s full Morning Lineup.
Bespoke’s Weekly Sector Snapshot — 6/8/23
B.I.G. Tips – Is the Pause Finally Here?
The Bespoke 50 Growth Stocks — 6/8/23
The “Bespoke 50” is a basket of noteworthy growth stocks in the Russell 3,000. To make the list, a stock must have strong earnings growth prospects along with an attractive price chart based on Bespoke’s analysis. The Bespoke 50 is updated weekly on Thursday unless otherwise noted. There were no changes to the list this week.
The Bespoke 50 is available with a Bespoke Premium subscription or a Bespoke Institutional subscription. With Bespoke Premium, you’ll receive a number of daily market updates from us along with our weekly newsletter and a portion of our investor tools. With Bespoke Institutional, you’ll receive everything that’s included with Premium plus additional daily macro analysis and more stock-specific research.
To see all 50 stocks that currently make up the Bespoke 50, simply start a two-week trial to Bespoke Premium or Bespoke Institutional.
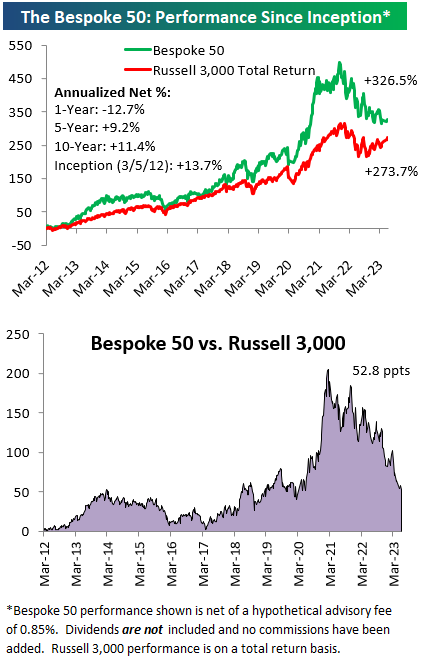
The Bespoke 50 performance chart shown does not represent actual investment results. The Bespoke 50 is updated weekly on Thursday. Performance is based on equally weighting each of the 50 stocks (2% each) and is calculated using each stock’s opening price as of Friday morning each week. Entry prices and exit prices used for stocks that are added or removed from the Bespoke 50 are based on Friday’s opening price. Any potential commissions, brokerage fees, or dividends are not included in the Bespoke 50 performance calculation, but the performance shown is net of a hypothetical annual advisory fee of 0.85%. Performance tracking for the Bespoke 50 and the Russell 3,000 total return index begins on March 5th, 2012 when the Bespoke 50 was first published. Past performance is not a guarantee of future results. The Bespoke 50 is meant to be an idea generator for investors and not a recommendation to buy or sell any specific securities. It is not personalized advice because it in no way takes into account an investor’s individual needs. As always, investors should conduct their own research when buying or selling individual securities. Click here to read our full disclosure on hypothetical performance tracking. Bespoke representatives or wealth management clients may have positions in securities discussed or mentioned in its published content.