Asset Class Performance During QT
As mentioned in our piece from earlier today, gold did not necessarily deliver superior performance during the last QT cycle. This leaves investors to ponder: which asset classes did deliver substantial returns? Is there anywhere to hide? Although the macroenvironment is vastly different this time around, it is still helpful to look at past occurrences to attempt to put a frame of reference around today’s markets. Major differences include rampant inflation (particularly in commodities), supply chain constraints, lapping stimulus benefits, and weakening economic data. Below, we summarize the performance of the S&P 500, bonds, agricultural commodities, and oil during previous QT cycles.
The S&P 500 outperformed Gold during the last QT cycle, gaining 19.2%, which constitutes an annualized return of 10.1%. The graph below outlines the performance of the S&P 500 ETF (SPY) during different cycles of QE and QT. As you can see, equities were not particularly steady during the last QT cycle, but SPY gained significantly after the Fed announced its intent to slow the balance sheet winddown.
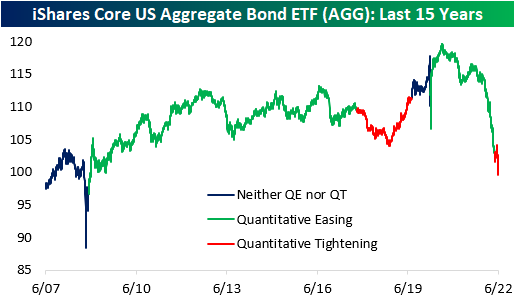
In the last QT cycle, the bond market initially sold off but managed to finish higher for the entire period. The iShares Core US Aggregate Bond ETF (AGG) bottomed at a drawdown of 4.7% about a year after the cycle began but proceeded to gain 6.7% through the final 203 trading days of the cycle. When all was said and done, AGG finished the cycle with gains of 1.7%. Similar to what we saw in gold, much of the gains were seen after the Fed announced its plan to slow the wind-down of the balance sheet. This suggests that rates rose at first but then reversed course when the Fed announced the impending end of QT. So far in the current cycle, AGG has already dropped by 2.7%, but bonds sold off hard in anticipation of QT in late 2021 and early 2022. On a YTD basis, the ETF is down a whopping 12.7%.
Agricultural commodities performed poorly during the last QT cycle, dropping 15.7%. This constitutes an annualized return of -8.9%, but the broader agricultural space was in a downtrend before QT began. Currently, agricultural commodities are in an uptrend, so it will be interesting to watch the price action as QT ramps up. On a YTD basis, the Invesco DB Agriculture Fund (DBA) is up 10.2% and is essentially flat since QT began in early May.
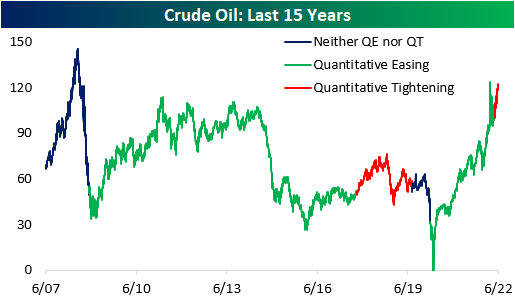
During the last QT cycle, crude oil gained 15.8%, but it would be difficult to attribute these gains to quantitative tightening. Since the Fed began tightening this year, crude oil has jumped 16.0% higher. In the last cycle, oil rallied higher before subsequently crashing, which would certainly be welcomed by many in this cycle. Click here to become a Bespoke premium member today!
Gold Performance During QT
Quantitative tightening (QT) has wide-spanning effects on the economy, as it puts upward pressure on risk-free interest rates due to increased supply in debt markets (assuming all else equal). The Fed announced its QT strategy just one meeting (5/3/22) after hiking its target rates for the first time since 2018 back in March. The previous QT cycle in 2017 did not begin until about two years after the Fed first started hiking rates. The reason for the quick turnaround this time around, though, stems from the fact that inflation has been running rampant, and the balance sheets of consumers and corporates are in relatively strong positions.
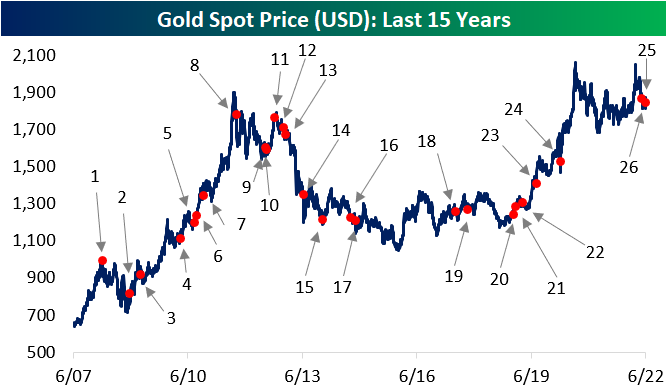
In terms of how various asset classes may perform in the current period of QT, some investors have looked back to the prior period of QT for insight. As mentioned above, there are some important distinctions between the current period and the last period of QT, so it may not be an apples-to-apples comparison, but there are certainly some similarities that can make knowing what happened back then helpful. Using the price of gold over the last 15 years as a backdrop, the chart below shows key events related to periods of quantitative easing (QE) and QT. The event surrounding each dot is summarized in the table below. Click here to learn more about Bespoke’s premium stock market research service.
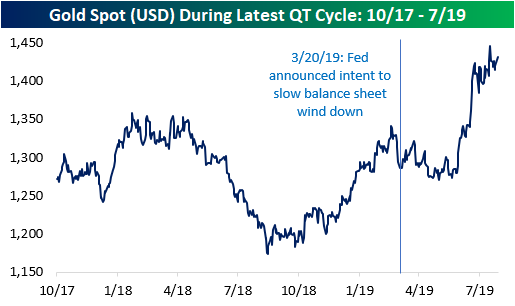
Between October 2017 and July 2019 (the last QT cycle), the price of gold rose by 12.6%, which works out to an annualized return of 6.5%. Over the last 15 years, the price of gold has held an annualized return rate of 6.8%, so there was no clear differentiation in the performance of gold during that period of QT and the last 15 years as a whole. Looking at the chart, though, much of the gains from the last cycle of QT came late in that cycle as the Fed had already announced its intent to end the running off of assets from its balance sheet. In fact, the S&P 500 outperformed gold by more than six percentage points during the last QT cycle. In fact, before the March 2019 announcement that the Fed would wind down its balance sheet, gold was practically unchanged relative to the start of the QT cycle. Click here to become a Bespoke premium member today!
Bespoke’s Morning Lineup – 6/15/22 – Fed Up
See what’s driving market performance around the world in today’s Morning Lineup. Bespoke’s Morning Lineup is the best way to start your trading day. Read it now by starting a two-week trial to Bespoke Premium. CLICK HERE to learn more and start your trial.
“Everything you’ve ever wanted is on the other side of fear.“ – George Adair
Below is a snippet of content from today’s Morning Lineup for Bespoke Premium members. Start a two-week trial to Bespoke Premium now to access the full report.
With last week’s CPI report behind us, the market shifted its focus to the FOMC rate decision, and that day has now arrived. Futures are higher heading into the report, but we just got a slug of economic data (Retail Sales, Empire Manufacturing, and Import and Export Prices). Overall, the results weren’t pretty with Export Prices the only indicator that came in higher than expected. Both Philly Fed and Retail Sales were not only weaker than expected, but they were also negative at the headline level. Economic data is going one way (down), and interest rates are going the other (higher).
In today’s Morning Lineup, there’s a lot covered as we discuss the latest moves in crypto (pg 4), the ECB emergency meeting to address spreads widening in peripheral countries (pg 4), a preview of tomorrow’s BoJ meeting (pg 4) and today’s Fed decision (pg 5), a recap of market moves in Asia and Europe (pg 5), overnight economic data in Asia and Europe (pg 6), and much more.
After four days in a row of 1% to multi-percentage point daily declines, yesterday’s 0.38% drop in the S&P 500 almost seemed like an up day. Nevertheless, yesterday’s decline was large enough to bring the S&P 500’s five-day decline to over 10% which is a magnitude of decline we haven’t seen since the COVID crash (when there were multiple). The chart below shows the S&P 500 (on a log scale) going back to 1960, and the red dots indicate any time when the trailing five-day return was greater than 10%. What’s really interesting to note about this chart is that prior to 2000, the only times since 1950 that the trailing five-day decline exceeded 10% were in May 1962, October 1987, and August 1998. Since 2000, though, these types of declines have become much more commonplace with spikes in downside volatility occurring every few years.

Start a two-week trial to Bespoke Premium to read today’s full Morning Lineup.
Daily Sector Snapshot — 6/14/22
Inflation Concerns Peak
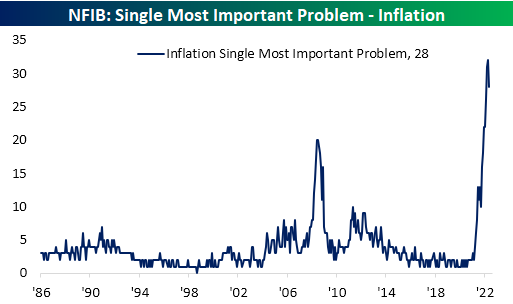
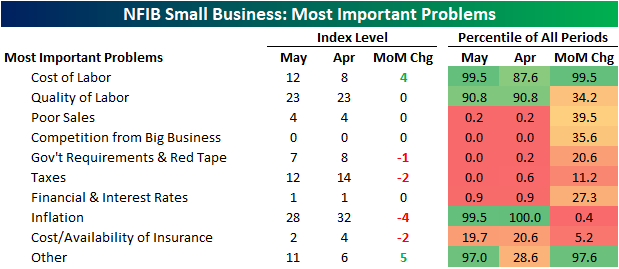
The NFIB released the results of its May survey of small businesses this morning, and even though the report showed the outlook for business conditions collapsed to a record low, there were other at least partially promising signs under the hood. Primarily, the percentage of respondents reporting inflation as their biggest concern finally appears to have peaked. After reaching a record high of almost a third of responses in April, a still-elevated but improved, 28% of small businesses reported inflation as their biggest concern. The decline in concerns over inflation ranked as the largest decline of any reported problem, but conversely, “other” saw the largest increase as it rose 5 percentage points month over month. Now at 11%, that reading is near some of the highest levels on record going back to 2008 (this response does not have as long dated of a history as the others which go back to 1986)
While the percentage of respondents reporting inflation as their biggest concern has peaked for the time being, that is not to say fewer businesses are concerned about rising costs. Behind the increase in “Other”, the next biggest month-over-month increase was cost of labor which rose four percentage points. That brings it to the highest level since December on its own as well as on a combined basis with quality of labor (which was unchanged month over month).
Inflation was not the only reading to fall month over month as fewer respondents also reported taxes as their biggest concern. Alongside another government-related reading, government requirements and red tape, the combined reading is at a record low.
Government-related indices were not alone with record low readings. 0% of respondents indicated that competition from big businesses was their most pressing issue as well while poor sales and financials & interest rates are just off record lows of their own. Click here to learn more about Bespoke’s premium stock market research service.
B.I.G. Tips – Fed Day Market Trends
Bespoke Stock Scores — 6/14/22
Bespoke’s Morning Lineup – 6/14/22 – One Way Market
See what’s driving market performance around the world in today’s Morning Lineup. Bespoke’s Morning Lineup is the best way to start your trading day. Read it now by starting a two-week trial to Bespoke Premium. CLICK HERE to learn more and start your trial.
“He says we’re going the wrong way.”
“Oh, he’s drunk. How would he know where we’re going.” – Planes, Trains & Automobiles
Below is a snippet of content from today’s Morning Lineup for Bespoke Premium members. Start a two-week trial to Bespoke Premium now to access the full report.
After four days of basically getting their faces beat inside out, bulls are trying to make a comeback this morning aided in part by a PPI report that wasn’t stronger than expected. Small business sentiment also managed to come in slightly better than expected, although it remains weak. One item covered in today’s Morning Lineup commentary is the fact that inflation expectations in the latest ZEW survey didn’t show a pickup in inflation expectations for the US or Eurozone.
In today’s Morning Lineup, there’s a lot covered as we discuss trading in APAC and European markets (pg 4), whether or not the Fed will go 50 or 75 bps tomorrow (pg 5), overnight economic data in Asia and Europe (pg 6), and much more.
Over the last two years or so, the market has come full circle. In February and March of 2020, there was that five-week period where the only direction the market would move was lower. Shortly after, the Federal Government and Federal Reserve unleashed massive amounts of stimulus, and the market started to turn around. By early 2021, the market had completed a complete 180, and the only direction it could move was higher. Then, late last year as government stimulus started to dry up and the Federal Reserve started to get religion on inflation, cracks in the market started to emerge. By early this year, we were calling it a one-step forward and two-step backward market where every positive day was offset by at least two bad days taking the market to progressively lower levels in the process.
As painful as the one-step forward and two-step backward market felt, at least there were some positive days. Over the last few days, it has become a one-directional market, and the direction has been extreme in the wrong way. Over the last four trading days, the net advance/decline (A/D) reading for the S&P 500 has been negative 400 or lower meaning that in each of the last four trading days there have been 400 more stocks that traded lower on the day than higher. To give you some perspective on how extreme this type of streak is, since 1990, there have been ten years where for the entire 12 months there weren’t even four days where the net A/D reading for the S&P 500 was at negative 400 or lower. As shown in the chart below, there has never been a streak of similar duration, and the only time there were even three consecutive days of -400 readings was in August 2015 at the height of concerns over the Chinese yuan devaluation.

Start a two-week trial to Bespoke Premium to read today’s full Morning Lineup.

