The Closer – Meaningless Minutes, Openings, Housing, Ag – 7/6/22
Log-in here if you’re a member with access to the Closer.
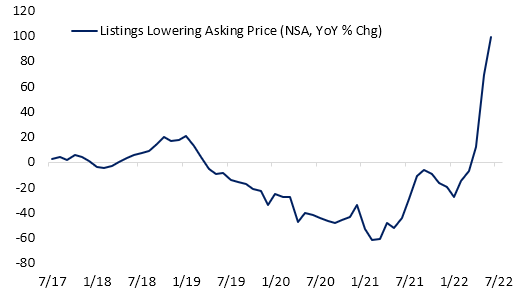
Looking for deeper insight into markets? In tonight’s Closer sent to Bespoke Institutional clients, we begin with a rundown of the minutes from the June FOMC meeting (page 1) followed by a look at job openings through today’s JOLTS report (page 2) and Indeed data (pages 3 and 4). We then pivot to housing data with the latest delinquency readings out of the Mortgage Monitor report from Black Knight (page 5) and realtor.com data covering inventories and prices (page 6). We then shift into the latest PMIs (page 7) before closing with a look into the declines in agriculture commodities (page 8).
See today’s full post-market Closer and everything else Bespoke publishes by starting a 14-day trial to Bespoke Institutional today!
Daily Sector Snapshot — 7/6/22
Gold Weakness
Investors often turn to Gold as a safe asset in tumultuous times, as the asset tends to hold its value during market downturns. For example, when the S&P 500 sold off by 34.1% during the COVID Crash, the SPDR Gold Trust (GLD) declined just 3.6%. In 2022, GLD initially acted as a strong hedge to the equity market, gaining 1.0% on a YTD basis on June 16th as SPY entered bear market territory. However, GLD topped out in early March and is now trading 14.0% off of its closing 2022 high. GLD has even underperformed SPY since March 8th, declining 14.0% versus SPY’s drop of 8.2%. Click here to learn more about Bespoke’s premium stock market research service.
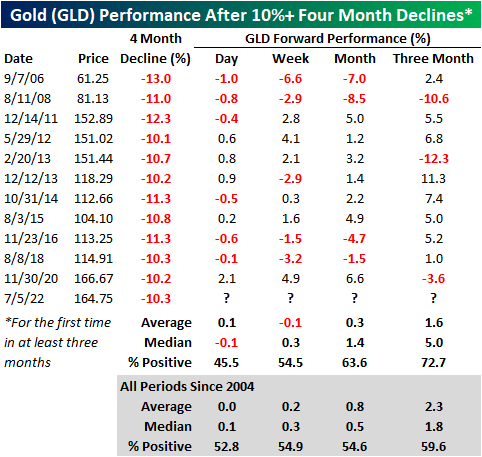
Over the last four months, GLD has declined by 10.3%, which is elevated for a relatively stable asset during a bear market. Since its inception in 2004, GLD has declined 10% or more over a four-month period (with no occurrences in the prior three months) twelve times with each occurrence shown in the chart below.
The forward performance following four-month declines of 10%+ has been mixed depending on the time frame. The next day (which would be today), GLD has booked a median loss of 10 basis points, gaining just 45.5% of the time. However, the median return and positivity rate in the next week is inline with historical averages. Over the one and three months, performance tends to pick back up, registering gains 63.6% and 72.7% of the time, respectively. Over the next three months, GLD has had a median gain of 5.0%, which is more than two and a half times the median of all periods. Click here to learn more about Bespoke’s premium stock market research service.
Chart of the Day – Crude and Copper Come Crashing Down
What Happened to Energy?
Up until June 8th, the Energy sector was the only thing working in the market. However, the sector has reversed dramatically, falling close to 25% since. This comes as the price of oil pulls back and the White House targets the entire vertical with accusations of profiteering. As any investor knows, the price of oil is not set by individual energy companies, but rather by the forces of the market. Interestingly, the same administration that is pressuring oil companies to increase supply campaigned on the fact that they would not allow for drilling permits to be renewed on federal land, so the current rhetoric is… interesting to say the least. To quote Biden himself: “Number one, no more subsidies for the fossil fuel industry. No more drilling on federal lands. No more drilling, including offshore. No ability for the oil industry to continue to drill, period.” Rhetoric like this can logically cause a reduction in domestic energy investments, as CFO’s adjust capital expenditures based on added legislative risk.
Nonetheless, the price of oil has pulled back significantly, which causes a compression in gross margins for suppliers. Oil is currently trading at about $100 per barrel. Although oil is still up over 33% YoY, it has pulled back by 23.3% relative to highs. Most industries will breath a sigh of relief, but energy companies will be in the other camp. Notably, crude recently broke its uptrend, and seven of the last 15 trading days have seen declines of 3% or more.
Below is a chart showing the rolling % of 3%+ daily declines over all 15-day periods. As you can see, this is an extremely elevated reading, surpassed by just The Great Recession and the COVID Crash. Following the high reading in 2008, XLE rebounded 8.9% in the next week and 7.8% over the next month. In March of 2020, XLE fell by an additional 13.1% over the next week, but rebounded 14.7% over the following month after the peak reading.
Below are snapshots of S&P 500 Energy stocks as they currently stand versus where they stood on June 8th when XLE peaked. All but one of the stocks have entered an oversold range after every single one was overbought as of 6/8. What a difference a month can make! On average, these stocks were up 66% YTD (median: 64.8%) on June 8th, but are now up an average of just 22.3% on a YTD basis (median: 18.0%). Between the close on 6/8 and 7/5, the average stock on this list fell by 26.1% (median: -26.7%), delivering pain to investors who bought the rip. Click here to learn more about Bespoke’s premium stock market research service.
Bespoke’s Morning Lineup – 7/6/22 – Negative But Stable
See what’s driving market performance around the world in today’s Morning Lineup. Bespoke’s Morning Lineup is the best way to start your trading day. Read it now by starting a two-week trial to Bespoke Premium. CLICK HERE to learn more and start your trial.
“There is no free market for oil. It’s controlled by a cartel, OPEC.” – Frederick W. Smith
Below is a snippet of content from today’s Morning Lineup for Bespoke Premium members. Start a two-week trial to Bespoke Premium now to access the full report.
Stocks are poised for a lower open this morning, oil prices are clinging to $100, and the 2s10s yield curve is modestly inverted. While equity futures have been lower all morning, they have been trading in a relatively tight range. That’s likely to change at around 10 AM Eastern with the release of the ISM Services report and the May JOLTS report. Then at 2 PM, we’ll get the release of the Fed minutes from the June meeting.
In today’s Morning Lineup, we discuss moves in Asian and European markets, along with a quick look at the latest moves in the euro and the developments in UK politics.
Less than a month ago today on June 8th, the S&P 500 Energy sector was up over 65% YTD, up more than 60 percentage points more than the next closest sector, and 90 percentage points ahead of the worst performing sector (Consumer Discretionary). Since then, Energy stocks have come crashing back down to earth, and while it remains the only sector up YTD, its lead over other sectors has narrowed.
With a YTD gain of 28.1%, the Energy sector ETF (XLE) leads the next closest sector, Utilities, by nearly 30 percentage points and still has a lead of nearly 60 percentage points over the worst-performing sector – Consumer Discretionary.

When we look at how far the Energy sector has declined from its 52-week high and compare that decline to how far other sectors have dropped from their 52-week highs, Energy is no longer a standout. In fact, with Energy down 25.3%, it has now declined more from its 52-week high than the S&P 500 has declined from its high (-20.4%). Of the eleven sectors, only three – Technology (XLK), Consumer Discretionary (XLY), and Communication Services (XLC) – have seen larger drawdowns from their respective highs than the Energy sector.
Investors tend to view their holdings from the lens of where they are trading relative to their peaks. With Energy now down just as much or more than most other sectors, plus the fact that a lot of inflows into the sector likely came closer to the June high, even the one sector that has been a bright spot for the market is probably not making too many investors happy these days.

Start a two-week trial to Bespoke Premium to read today’s full Morning Lineup.
Tough Day For Commodities
So far in 2022, sky-high commodity prices have plagued equity markets. As input prices have surged for corporations, consumers have faced record-high gas prices, and families are forced to spend A LOT more on food. This has led to a compression in discretionary budgets among consumers, record-low consumer confidence readings, and multi-decade lows in investor sentiment. Yesterday, commodity prices fell sharply as speculators feared demand destruction due to rising recessionary risks. Although the reasoning for the selloff is certainly not positive for the broader economy, investors breathed a sigh of relief as one of the major economic/market headwinds eased. Click here to learn more about Bespoke’s premium stock market research service.
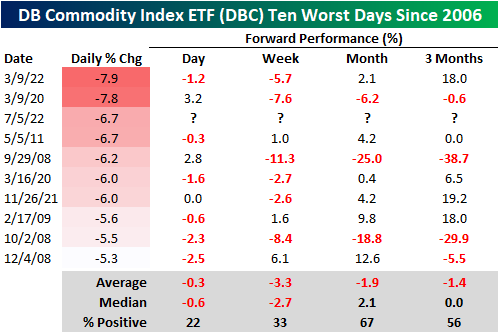
Yesterday’s move was the third-largest downside move in the Invesco DB Commodity Index ETF (DBC) since its inception in 2006, falling short of just two occurrences in March 2020 and March 2022. Following yesterday’s decline, DBC is now down over 18% from its June 9th high and up ‘just’ 20.2% YTD. Over the last 12 months, though, DBC is still up 73.6%.
Following the other nine worst days in DBC’s history, the median forward performance has been relatively weak, which by itself, is a positive for corporations and all other commodity consumers. In the next week, DBC has only performed positively one-third of the time, booking a median loss of 2.7 percentage points. Over the following three months, DBC has appreciated 56% of the time and has tended to remain flat on a median basis. In three of the nine prior occurrences, DBC rallied 18% or more over the next three months, while it declined 29% or more twice. Click here to learn more about Bespoke’s premium stock market research service.
Daily Sector Snapshot — 7/5/22
International Check-Up
The S&P 500 is down 20.8% on a YTD basis, which is worse than all of the international indices we looked at apart from the DAX (German stock market index) and ITLMS (Italy stock market index). Although the YTD performance is weak relative to other countries, performance relative to pre-COVID levels is still elevated, so long-term investors have been rewarded by investing in the US. Relative to mid February of 2020 just before COVID hit the West, the S&P 500 ranks third out of the 12 indices we looked at, falling short of just Argentina (Merval) and Chile (IGPA). Click here to learn more about Bespoke’s premium stock market research service.
Of the 12 international indices, eight are down relative to pre-COVID levels. The biggest decliners have been Hong Kong (Hang Seng), Spain (IBEX 35) and Italy (ITLMS). The charts below show the five year performance of each international index that we looked at (and the S&P 500). As you can see, five year returns are now negative for the DAX, the Hang Seng, the FTSE Italia, the IBEX 35 and the FTSE 100. So much for the benefits of international diversification!
The table below summarizes each index’s performance over the last five years, relative to pre-COVID levels, and on a YTD basis. Much of the differentiation in performance can be attributed to the means of each respective economy. For example, Argentina and Chile largely export materials, making the economies highly correlated to price moves in commodities. On the other hand, Western nations tend to have a healthy mix of industrial products, commodities and services. Click here to learn more about Bespoke’s premium stock market research service.
Firearm Background Checks
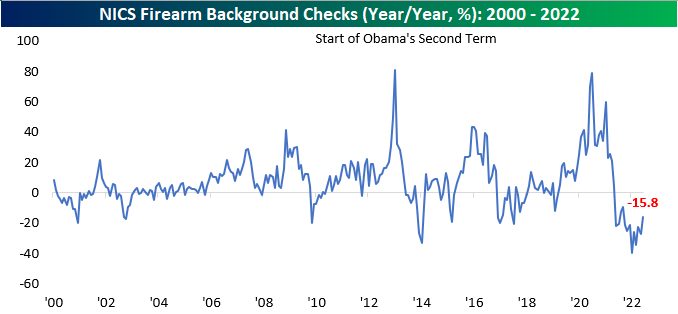
We track the number of NICS firearm background checks on a regular basis as it often provides interesting insights on the mood of Americans or the direction of political winds regarding gun control legislation. In times of higher volatility, uncertainty, or concerns that lawmakers in Washington will enact stricter legislation for firearms, purchases tend to rise. On the other hand, in periods of stability, background checks tend to fall. Ever since June of last year, background checks have been declining on a y/y basis, but the y/y decline moderated in June. Although still down 15.8% compared to last year, purchases moved higher sequentially for the first time in three months. Click here to learn more about Bespoke’s premium stock market research service.
Although checks moved higher month over month, they are likely to rise even further in July due to the Supreme Court’s recent ruling against the state of New York. This case expands the right to carry, and will likely increase firearm purchases in some of the most restrictive cities, such as New York and Los Angeles. In June, background checks rose by over 230K to reach 2.6 million. Although checks are in a near-term down-trend following the COVID spike, the longer-term uptrend is still very much intact.
On a YTD basis, background checks have declined at the fastest rate on record. This is largely due to elevated comps, as 2021 saw background checks near record levels due to a growing political divide, COVID lockdowns, and fears over legislation with Democrats in full control of Washington D.C.
Although background checks moved higher month over month, Sturm Ruger (RGR) and Smith and Wesson (SWBI) hit 52-week lows in June. All-in-all, RGR traded 6.3% lower in June, and SWBI declined 15.2%. The stocks have been weighed down by slowing sales over the last couple of quarters, increased legal risk associated with firearm manufacturer liability, and the pull of the overall market tide. Both these stocks are still in sustained downtrends, and even after initially moving higher following the Supreme Court decision, both stocks have essentially come full circle. Click here to learn more about Bespoke’s premium stock market research service.


