Large vs Small Gap Keeps Widening
With each passing day this year, it seems as though the underperformance of small caps relative to large caps keeps getting wider. While the small-cap Russell 2000 is currently down over 30% from its post-Covid highs and within 1% of a multi-year low, large caps have held up relatively well as the S&P 500 is less than 12% from its post-Covid high. As a result of the divergence, the large-cap S&P 500 is outperforming the small-cap S&P 600 by more than 15 percentage points in 2023.
Just like the overall indices, the performance gap between the two is also wide across most sectors. The chart below compares the YTD performance of large (S&P 500) and small-cap (S&P 600) sectors so far this year. Amazingly, while the large-cap Communication Services and Technology sectors are both up over 30% YTD, their smaller-cap peers are either slightly down or just marginally higher. Within the Consumer Discretionary sector, there has been a similar pattern although to a less extreme of degree.
Outside of those three sectors, there really isn’t much in the way of gains for other large-cap sectors, but even if they are flat to down on the year, they’re still outperforming their smaller-cap peers. Of the eleven sectors, the only three where small caps are outperforming large caps are Consumer Staples, Energy, and Industrials. In the two latter sectors, not only are they outperforming, but they’re also the only two sectors in the S&P 600 with gains on a YTD basis. Imagine that, gains in small caps!


Bespoke’s Morning Lineup – 10/25/23 – Mixed Wednesday
See what’s driving market performance around the world in today’s Morning Lineup. Bespoke’s Morning Lineup is the best way to start your trading day. Read it now by starting a two-week trial to Bespoke Premium. CLICK HERE to learn more and start your trial.
“Computers are useless. They can only give you answers.” – Pablo Picasso

Start a two-week trial to Bespoke Premium now to get full access to the Morning Lineup.
It’s looking like a mixed open for the equity market this morning as Dow futures are higher, while S&P 500 and Nasdaq futures are in the red. The pace of earnings is really picking up, and it’s only going to get busier in the coming days. One thing we would note is that in a tape that has been weak for the last several weeks, the ability of the market to get back on track yesterday after the late morning sell-off was encouraging.
In fixed income, we’re seeing a bear steepening of the Treasury yield curve as 10-year yields are up 2 bps to 4.86% while the 2-year yield is slightly lower at 5.09%. Crude oil and gold are basically flat at $83.70 per barrel and $1,987 per ounce, respectively.
On the economic calendar, the only major report is New Home Sales at 10 AM. Economists are expecting a modest increase to 681K from last month’s reading of 675K. Mortgage applications were already released, and they showed a decline of 1% compared to last week’s drop of 6.9%
Despite strength in shares of Microsoft (MSFT), which are up over 3.5% in pre-market trading, Nasdaq futures are lower as shares of Alphabet (GOOGL), where results in its cloud unit were weaker than expected, are trading down over 5%. That puts the stock on pace for its weakest downside gap in reaction to earnings since a year ago today when it opened down nearly 8%. In its history as a public company, there have been ten prior days where GOOGL gapped down more than 5% in reaction to earnings. On those days, the stock’s median performance from the open to close has been a decline of 2.0% with gains just three out of ten times.

While GOOGL’s reaction to yesterday’s earnings report has been weak, we’d note that over the last year, the stock has traded down in reaction to earnings three times with declines ranging from 0.2% up to 9.6%, and yet since the start of October 2022, the stock has still managed to rally 45%. One day doesn’t necessarily make a trend.

Turning back to the market, it seems somewhat hard to believe, but through yesterday’s close, the S&P 500 was down less than 1% in October. With just a week left to go in the month, in the chart below we show the performance of the S&P 500 in the last week of October for every year since 1952 when the current version of the five-trading day week began.
The last week of the month has tended to be positive with a median gain for the S&P 500 of 0.64% and gains 63% of the time. For perspective, the average one-week performance of the S&P 500 since 1952 has been a gain of just 0.17% with gains 56% of the time.

Looking at performance another way, the chart below compares month-to-date performance for the S&P 500 through 10/24 (x-axis) to its performance in the last week of the month (y-axis), and the shaded region shows periods when the S&P 500 was down between zero and 2.5% heading into the last week of the month. During these periods, performance was like the last week of October for all years with a median gain of 0.87% and gains 59% of the time. Overall, there is a slight (and we stress slight) inverse correlation between MTD performance heading into the final week of the month and its performance during the last week, but nowhere near enough to even consider making an investment decision about it.

Sign up for a two-week trial to Bespoke Premium to continue reading more of today’s macro analysis.
Daily Sector Snapshot — 10/24/23
Bespoke Stock Scores — 10/24/23
Chart of the Day – Software is Eating the…Budget
Breadth Bombs
A frequent point of discussion this year has been breadth, or more specifically, the massive impact of mega caps on the market-cap-weighted S&P 500’s year-to-date performance (something we discussed in yesterday’s update of our Sector Weightings report). We often use the 10-day advance-decline (A/D) line to measure how breadth is evolving in the near term; highlighting these readings for the S&P 500 and its eleven sectors daily in the Sector Snapshot. This indicator essentially shows the average net percentage of daily advancers versus decliners in an index over a two-week period.
In the chart below, we show the S&P 500’s 10-day A/D line (expressed as standard deviations to clarify overbought/oversold levels) over the past year. The past week has seen a monumental shift in breadth. Just one week ago, the 10-day A/D line was deeply overbought sitting 1.72 standard deviations above the historical average, but as of yesterday’s close, it has fallen all the way into oversold territory; a 2.9 standard deviation drop in only four days.

Looking back to the start of our data in 1990, that is one of the largest four-day declines on record. In fact, the last time the line fell by such a degree or more was in September 2022 when there was a record decline.

While two-standard deviation declines have been uncommon, even fewer have resulted in the 10-day A/D line going from overbought to oversold. In the table below, we highlight those nine prior instances that have occurred with at least 3 months having passed since the last occurrence. The current period holds one of the higher starting readings in the 10-day A/D line. In fact, only November 2011 saw a higher reading.
As for S&P 500 performance going forward, returns have generally been mixed. One week after big ‘breadth bombs’ the index has actually risen better than three-quarters of the time, however, one month out has averaged a decline with positive returns less than half the time. Three months out to one year on have all averaged positive returns, but those are all weaker than the norm.

Bespoke’s Morning Lineup – 10/24/23 – Bitcoin Breakout
See what’s driving market performance around the world in today’s Morning Lineup. Bespoke’s Morning Lineup is the best way to start your trading day. Read it now by starting a two-week trial to Bespoke Premium. CLICK HERE to learn more and start your trial.
“Coming up with an idea is the least important part of creating something great.” – Larry Page
Start a two-week trial to Bespoke Premium now to get full access to the Morning Lineup.
Equity futures are trading higher for what seems like a change this morning after the S&P 500 has posted five straight days of losses. Positive earnings news seems to be driving the gains. We’re starting to see a heavier flow of larger companies report, and this morning’s batch has been generally better than expected. The real test will come after the close, though, as we’ll hear from Alphabet (GOOGL) and Microsoft (MSFT) after the close. Treasury yields and crude oil are generally behaving this morning, and the only data on the economic calendar is preliminary PMI readings for the Manufacturing and Services sectors, as well as the Richmond Fed Manufacturing Index.
After trading in a relatively tight range over the last six months and seeing its daily volatility converge to levels more in line with a long-term US Treasury, bitcoin prices have been rallying over the last few days, capping it off with a gain of nearly 10% today. Prices briefly surged past $35,000 overnight, and while they have pulled back from those highs, the world’s largest cryptocurrency is on pace for its highest close since May 2022. Optimism over approval for a spot ETF has been cited for the gain, but rising geo-political instability and concerns over sovereign debt loads can’t be ruled out either.

While prices got there briefly overnight, bitcoin is currently on pace to come up just short of a double-digit single-day percentage gain. Heading into today, the current streak without a one-day gain of at least 10% was 224 calendar days (bitcoin trades every day) which ranked as the longest streak since the 229-day streak that ended in November 2018. Before that, the only other streak that was longer was the 272 days ending in March 2017.

Sign up for a two-week trial to Bespoke Premium to continue reading more of today’s macro analysis.
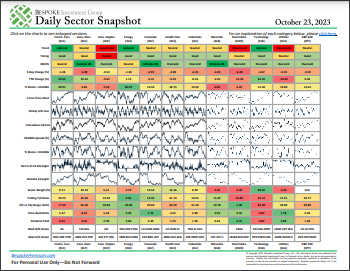
Daily Sector Snapshot — 10/23/23
Please click the thumbnail image below to view today’s Daily Sector Snapshot.