Bespoke’s Morning Lineup — 10/26/22
See what’s driving market performance around the world in today’s Morning Lineup. Bespoke’s Morning Lineup is the best way to start your trading day. Read it now by starting a two-week trial to Bespoke Premium. CLICK HERE to learn more and start your trial.
“Solving big problems is easier than solving little problems.” – Google Co-Founder Larry Page

Below is a snippet of content from today’s Morning Lineup for Bespoke Premium members. Start a two-week trial to Bespoke Premium now to access the full report.
Bulls have finally seen some green over the last couple of weeks. In fact, the S&P 500 has gained 1%+ on six of the last nine trading days. Below is a log chart of the S&P 500 since 1952 (when the 5-day trading week began) with red dots showing prior times the index has gained 1%+ on six of the prior nine trading days (the first occurrence in at least three months). As you can see, it is not common, and aside from the occurrence in March of this year, prior periods where this happened saw massive gains over the next six and twelve months.


Our Morning Lineup keeps readers on top of earnings data, economic news, global headlines, and market internals. We’re biased (of course!), but we think it’s the best and most helpful pre-market report in existence!
Start a two-week trial to Bespoke Premium to read today’s full Morning Lineup.
Bespoke Stock Scores — 10/25/22
Near Record Volatility in the 10-Year Yield*
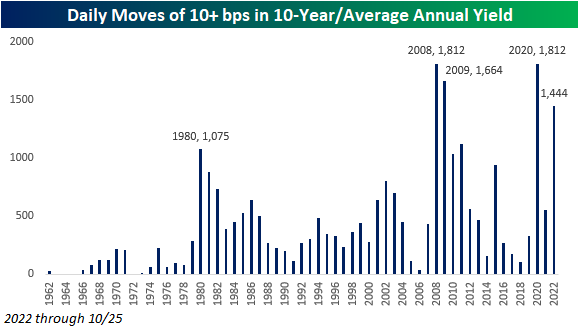
The 10-year is having another one of those days. After trading up near 4.3% intraday yesterday, the yield got as low as 4.05% this morning and is currently resting at 4.09% for a decline of 14 basis points on the day. In a normal year, we’d be talking about a move of that magnitude as a volatile day, but in 2022, it has become commonplace. Today is actually the 40th trading day this year that the 10-year yield has moved 10 bps or more relative to the prior day’s close. Relative to history, this year’s total of daily 10 bps moves (through 10/25) ranks as the highest since 2009 when there were 54. As shown in the chart below, there have been plenty of other years where the 10-year yield had a much larger frequency of 10 bps daily moves, including 2008 (66) and the early 1980s when both 1980 and 1981 had a total of 123, or roughly once every other trading day.

Based on the chart above, 2022 may look unremarkable in terms of daily volatility, but it’s leaving out a key variable and that’s the actual level of the yield on the 10-year at the time of the move. A 10 bps daily move is a lot more significant when the average yield on the 10-year is 2.8% as it has been this year compared to a year like 1980 or 1981 when the average yields were 11.4% and 13.9%, respectively. In order to adjust for the level of yield, the chart below shows the ratio of the number of days where the 10-year yield moved 10 bps versus the average yield of the 10-year during the specific year. After making that adjustment, 2022 still isn’t at a record, but it’s close. In both 2008 and 2020, the ratio was 1,812, and in 2009 it was 1,664. At 1,444, the ratio for 2022 ranks as the fourth highest on record. Already this year, 2022 ranks as one of the most volatile, in terms of daily yield changes, but there are still over two months left in the year. If the current pace continues through year-end, we could revisit this chart in just over two months and find that the ratio for this year was higher than any other year on record. Click here to learn more about Bespoke’s premium stock market research service.
Bespoke’s Morning Lineup – 10/25/22 – The Marshall Move
See what’s driving market performance around the world in today’s Morning Lineup. Bespoke’s Morning Lineup is the best way to start your trading day. Read it now by starting a two-week trial to Bespoke Premium. CLICK HERE to learn more and start your trial.
“There are a lot of mistakes made in games. That one just happened to be more visible than some of the others.” – Jim Marshall
Below is a snippet of content from today’s Morning Lineup for Bespoke Premium members. Start a two-week trial to Bespoke Premium now to access the full report.
58 years ago today, Vikings defensive end Jim Marshall recovered a 49ers fumble and ran it back to the endzone for a defensive touchdown. At least he thought it was. Unfortunately for Marshall, he ran into the wrong endzone turning what he thought was a Vikings touchdown into a safety. The Vikings still ended up winning the game, so the only people potentially impacted by Marshall’s bonehead play were the gamblers.
Less than two weeks ago, the S&P 500 closed at a new low for the year the day before what was widely anticipated as the most important economic report in weeks with the release of the September CPI on 10/13. That report was a ‘big play’ for the bears as both the headline and core readings came in higher than expected, and the y/y core reading hit a new cycle high of 6.6%. Stocks opened the day of the 13th sharply lower, and bears continued to run with it from there. Like Jim Marshall, though, they went the wrong way! The S&P 500 finished the day of the 13th up 2.6% and is now up 6.3% from its closing low on 10/12.
Despite the rally, 2022 is still a blowout as the S&P 500 remains down over 20% YTD with the Nasdaq down nearly 30%, so, like the “Purple People Eaters” of the early 1960s, the bears can still laugh about the wrong way move. The chances for Bulls this year are still slimmer than they are of Lloyd Christmas ending up with Mary Swanson, but stranger things have happened. Back in Super Bowl LI, the Falcons were up 28-3, and we all remember how that one ended. So “there’s a chance” however slim it may be.
The ‘wrong way rally’ has taken a breather this morning as futures are moderately lower ahead of a relatively busy day for economic data with Case Shiller housing numbers at 9 AM and then Consumer Confidence the Richmond Fed report at 10 AM. With the weakness in equities, treasury yields are lower and crude oil is down about 1%. The pace of earnings reports has really picked up steam and the results this morning have been somewhat lackluster. Of the nearly 40 reports so far this morning, 64% have exceeded EPS forecasts, and 62% of exceeded revenue estimates. Also slightly more companies have lowered guidance than raised it. The first big test of the earnings season will start after the close, though, when Alphabet (GOOGL) and Microsoft (MSFT) report after the close.
It seems as though this year stock prices have been driven entirely by interest rates, but a close look shows that in recent weeks that hasn’t entirely been the case. Take a look at the chart of the S&P 500. While it briefly broke below its June lows in late September and early October, it has recently rebounded and yesterday actually closed more than 3% above its June low.

If interest rates were the primary driver of stock prices, given where the S&P 500 is trading, you would expect to see the US Treasury yields right around or maybe even below the levels it was at in mid-June. That hasn’t been the case though. Take the 10-year yield, for example. At the S&P 500 lows in June, the yield on the 10-year peaked at 3.47%. It eventually fell back down to as low as 2.57% in early August, but since then has surged right through the June highs all the way up to yesterday’s high of 4.27%, or 80 basis points more than the June high. The fact that equities have been able to hang in relatively well despite the surge higher in yields suggests that stocks may be starting to look past the pressure from higher rates.

Our Morning Lineup keeps readers on top of earnings data, economic news, global headlines, and market internals. We’re biased (of course!), but we think it’s the best and most helpful pre-market report in existence!
Start a two-week trial to Bespoke Premium to read today’s full Morning Lineup.
Chart of the Day: It’s Good to Be Old
Daily Sector Snapshot — 10/24/22
B.I.G. Tips – Rates vs Stock Prices Reach Extreme Repulsiveness
Chinese Stocks Weigh on FAANG+
As we discussed this morning in the Morning Lineup, news out of China has sent shares of US-listed Chinese stocks tumbling. While that may sound like a concentrated issue, that weak performance actually has interesting implications for a measure of mega-cap stocks. Over the past several years, the NYSE FAANG+ Index has been a well-tracked measure of the mega caps and two members of that index are two of the largest Chinese stocks: Alibaba (BABA) and Baidu (BIDU). Given the index is equal weight, the declines of more than 14% in both stocks today are not weighing too heavily on the index, but we would note their performance drastically changes what would otherwise be a somewhat optimistic-looking chart.
Below we show the NYSE FAANG index as normal and without those Chinese stocks over the past year both indexed to 100 one year ago. The original index (red line) remains firmly in its downtrend over the long term and since the summer. However, when BIDU and BABA are removed (blue line), that summer downtrend has definitively been broken. That is not to say mega-caps have completely reversed the long-term picture, but the FAANG stocks’ short-term chart might be more positive than at face value.

Turning to the individual FAANG stocks’ charts, Microsoft (MSFT) and Apple (AAPL), which as we discussed in today’s Chart of the Day, are scheduled to report on Tuesday and Thursday, respectively, have begun to break out of their summer/fall downtrends. While that is a positive development at least in the near term, there is still resistance ahead at each stock’s moving averages. With the potential catalysts of earnings, later this week we should have a better idea of whether or not those breakouts are pump fakes or the start of something more material.


While those mega-cap moves have been promising to a degree, Amazon (AMZN) has been met with the opposite fate. AMZN likewise attempted to break out of the past few months’ downtrend in the past few days, but today, it has met resistance.

As for another FAANG member that has already reported, Netflix’s (NFLX) recent chart developments have been even more constructive. After a double-digit percentage jump in response to stronger-than-expected subscriber growth last week, NFLX has moved above both its 50 and 200-DMAs and is now filling the massive gap down from its April earnings report when it declined 35% in a single day. Of course, there is plenty of progress left to be made to erase the massive declines of the past year, but the move higher this earnings season has been a welcome relief. Click here to learn more about Bespoke’s premium stock market research service.
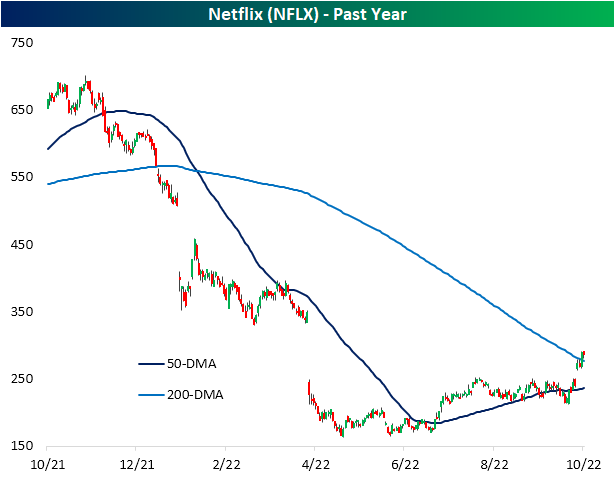
Chart of the Day: MAGA Earnings
Bespoke’s Morning Lineup – 10/24/22 – A Strong Start
See what’s driving market performance around the world in today’s Morning Lineup. Bespoke’s Morning Lineup is the best way to start your trading day. Read it now by starting a two-week trial to Bespoke Premium. CLICK HERE to learn more and start your trial.
“Diversity in the world is a basic characteristic of human society, and also the key condition for a lively and dynamic world as we see today.” – Hu Jintao
Below is a snippet of content from today’s Morning Lineup for Bespoke Premium members. Start a two-week trial to Bespoke Premium now to access the full report.
It’s been a roller-coaster morning for US equity markets since futures opened for trading last night. After opening sharply higher, futures drifted lower all morning before bottoming out between 4 AM and 6 AM eastern time. Investors remain optimistic following Friday’s surprise WSJ ‘leak’ of the potential for a Fed pause to rate hikes later this year. While the Fed is moving markets this morning, earnings are likely to take a more front-and-center role this week as more than 150 S&P 500 companies are set to report this week, including the largest companies in the index. On the economic calendar, the only reports of note are the Chicago Fed National Activity Index and the flash S&P Manufacturing PMI.
While free markets are all rallying this morning, the same can’t be said for Chinese markets where Xi’s consolidation of power at the national party congress after his predecessor Hu Jintao was unceremoniously escorted out has investors running for the exits. Hu Jintao may have said in his comments that he advocated for diversity, but Chairman Xi has consolidated power into a tight group composed entirely of loyalists to his views. The KraneShares CSI China Internet ETF (KWEB) is trading down below $20 per share today to all-time lows and is down 82% from its all-time high in February 2021. That’s an even larger drawdown than the Nasdaq had from the dot-com bust!

Today’s new low in the KWEB comes from what is poised to be a 12.5% decline at the open, which, if it holds up through the close, would be the largest single-day decline in the ETF’s history going back more than 20 years!

The Chinese currency has also been under considerable pressure lately. In today’s trading, the renminbi exchange rate rose above 7.26 which is the weakest level since January 2008, taking out the lows seen in the year leading up to COVID when President Trump began the trade war with the country.

Our Morning Lineup keeps readers on top of earnings data, economic news, global headlines, and market internals. We’re biased (of course!), but we think it’s the best and most helpful pre-market report in existence!
Start a two-week trial to Bespoke Premium to read today’s full Morning Lineup.