Q2 2026 Earnings Conference Call Recaps: Capital One (COF)
Bespoke’s Conference Call Recaps use AI to summarize lengthy earnings calls. The commentary below is AI-generated and then edited by Bespoke for quality control. As always, none of these summaries should be construed as recommendations to buy or sell any securities, and investors should do their own research and/or consult with a financial professional before making any investment decisions.
Our latest recap available to Bespoke subscribers covers Capital One’s (COF) Q2 2026 earnings call.
![]()
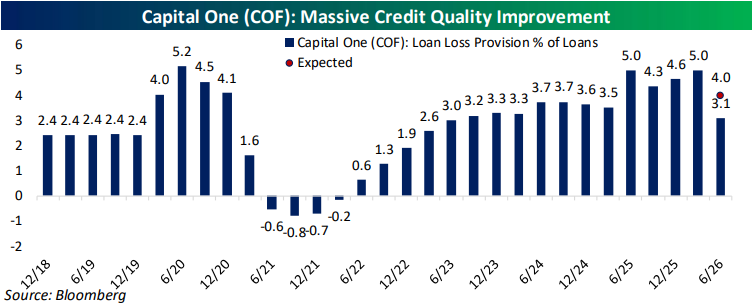
Capital One (COF) is a technology-focused financial institution offering credit cards, consumer and commercial banking, auto lending, and the Discover payments network. Its recent $5.15 billion acquisition of Brex adds corporate cards, expense management, and banking software to a business already transformed by the 2025 Discover acquisition. The quarter painted a healthy picture of both Capital One and its customers. Customers are still spending, payment rates remain above pre-pandemic levels, and recent card accounts are performing better than those opened in 2022 and 2023. Discover card loans fell 1.5% after earlier cutbacks in lending, but management considers that slowdown temporary. Half of Discover’s new accounts have moved onto Capital One’s systems, with the rest expected by the end of the third quarter. Capital One is also testing moving its own credit cards onto the Discover network while expanding international acceptance. Brex is already benefiting from Capital One’s lower funding costs and customer referrals, though broader marketing and product opportunities will take longer to implement. Although COF produced better-than-expected EPS and revenue, shares fell as much as 3.2% on 7/22…
Continue reading our Conference Call Recap for COF by becoming a Bespoke Institutional subscriber. You can sign up for Bespoke Institutional now and receive a 14-day trial to read our newest Conference Call Recap. To sign up, choose either the monthly or annual checkout link below:
Six Sectors and a Case of Mixed Signals
The S&P 500 rallied 0.89% yesterday, but the gains were far less widespread than the move suggested. Net breadth (the # of individual stocks advancing minus declining) for the index came in at -41, and six of eleven sectors saw price move in the opposite direction of their underlying breadth. In other words, more than half of the market’s sectors finished with positive price action yesterday even though they had more decliners than advancers.
That degree of disagreement has been rare. Since 1990, there have only been 13 trading days when price and breadth diverged in at least six sectors, including yesterday. These occurrences have become noticeably more frequent, though, as six have come since November 2023 compared with just seven over the prior 33 years. No day has ever seen more than seven sectors diverge, and that has happened only twice, most recently on January 25th, 2011.
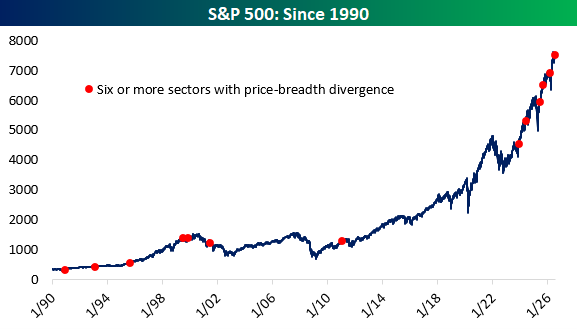
As shown below, these divergences have not historically been a bearish sign for the broader market. The S&P 500 was higher one month later 75% of the time, with an average gain of 1.26%, and three months later in 83.3% of cases, with an average gain of 4.49%. Six-month returns were positive following 10 of the 11 prior occurrences with enough time elapsed, while one-year returns were positive 80% of the time. The exception worth noting came on July 3, 2001, when price and breadth diverged in six sectors in the middle of the dot-com bear market. Over the following year, the September 11 attacks and the failures of Enron and WorldCom added to an already difficult backdrop, and the S&P 500 fell 22.72%.
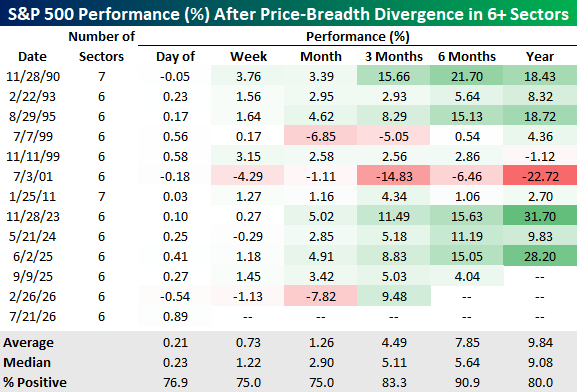
With only a dozen prior examples, the record is too limited to treat yesterday’s divergence as a surefire signal. While returns have generally been positive, the one-year average gain of 9.84% and 80% positive rate are also broadly in line with the market’s long-term historical performance.
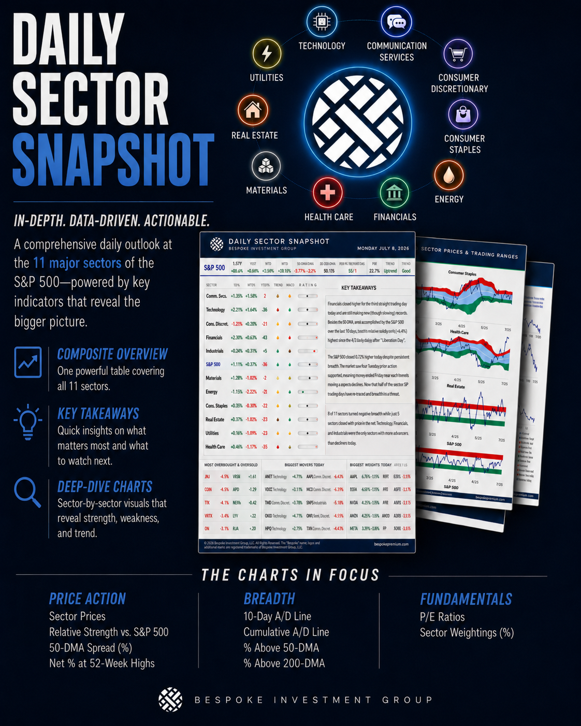
You can find more sector research like this in Bespoke’s Daily Sector Snapshot.
Read about Bespoke’s premium membership options to find out how to receive our Sector Snapshot in your inbox daily.
Bespoke’s Morning Lineup – 7/22/26 – Where’s Google?
See what’s driving market performance around the world in today’s Morning Lineup. Bespoke’s Morning Lineup is the best way to start your trading day. Read it now by starting a two-week trial to Bespoke Premium. CLICK HERE to learn more and start your trial.
“Having been trained as a computer scientist in the 90s, everybody knew that AI didn’t work.” – Sergey Brin, 1/19/2017

Below is a snippet of commentary from today’s Morning Lineup. Start a two-week trial to Bespoke Premium to view the full report.
Bulls may have breathed a sigh yesterday that the market was able to hold its gains through the opening bell, but it hasn’t been able to hold them into today’s open as S&P 500 futures fall 0.40%, and the Nasdaq is set to open nearly a full percentage point lower. Treasury yields continue to march higher with the 10-year yield at 4.64%.
The culprit for both moves has largely been oil. WTI is up over 3% and back above $87 per barrel while Brent is back over $94. Gold prices are up over 1% to $4,131 per ounce, and Bitcoin is down about 1% but still above $65K.
Asian stocks had a mixed session overnight. Japan and Hong Kong both traded lower while China and South Korea were fractionally higher. Don’t let the modest gains in the KOSPI fool you, though. For most of the day, the index was up over 5% before succumbing to selling pressure into the close.
In Europe, stocks are higher across the board, though gains are modest, with most major benchmarks up less than 1%. The UK is the one exception, gaining 1.2% as CPI for June was right in line with forecasts.
In the US today, there’s no economic data on the calendar, but there have been several earnings reports in the pre-market, and the main event after the close will be Alphabet (GOOGL) and Tesla (TSLA).
Speaking of Alphabet, since the launch of ChatGPT in late 2022, the consensus has repeatedly concluded that Google had missed the boat on AI. It started with the initial release of ChatGPT when everyone said, “Where’s Google?” The company’s response was a “Code Red” all-hands-on-deck meeting to address the threat of ChatGPT and devise a strategy to respond. Internally, Google had its own LaMDA chatbot, but the company was reticent to release it over questions regarding the accuracy of its responses. ChatGPT had its own issues, but given the start-up nature of that company, they recognized that cool was just as important as accuracy.
The following February, after months of preparation, Google finally unveiled its response to ChatGPT, and in a much-ballyhooed presentation, they came up with Bard, which was anything but cool and landed on the market like New Coke. The stock plunged nearly 10% in response for its worst two-day decline since the Financial Crisis. As Google executives reeled, Sam Altman and the rest of management at OpenAI were popping champagne bottles.
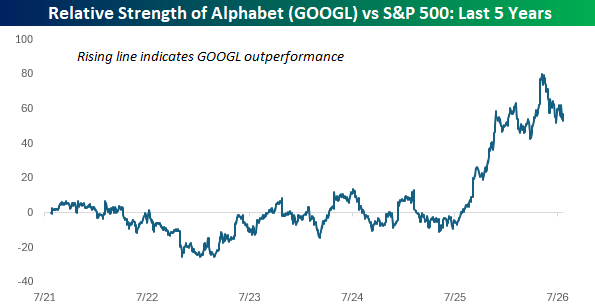
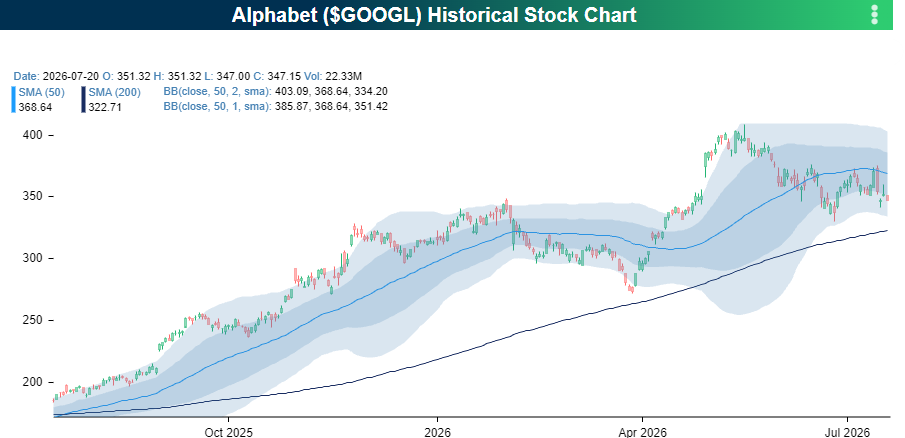
Google shares didn’t do much on a relative basis for most of the current bull market, and up until last July, the stock had performed exactly in line with the S&P 500 over the trailing four years. Over the last year, though, shares have massively outperformed the S&P 500 in one of the best yearly runs in its history.
Besides impressive growth in the cloud business, the company’s efforts to monetize AI have proved successful. AI not only hasn’t displaced search, but growth in that business has accelerated. Gemini has also been a success as last year’s launch of Gemini 3 was seen as a formidable competitor to the market’s other leading models. Google has even gotten the Berkshire Hathaway stamp of approval with Warren Buffett initiating a $40+ billion equity investment in the company.
In the market, you’re only as good as your latest product, and Google is once again under the gun. The main battleground of AI now is coding, and the market once again finds itself asking “Where’s Google?” Bloomberg recently reported that Google is woefully behind in launching Gemini 3.5 Pro as star employees gripe about and even leave the company over its glacial pace in moving projects forward. Just as it took months to respond to ChatGPT, with the rise of agentic coding, Google once again looks flat-footed.
The repeated instances of the market viewing Google as behind the AI curve are even more remarkable when you read the headline below from Google founder Sergey Brin, where he admits that he didn’t see AI coming. Given the recent history, you may think it was from late 2022 or after that, but it’s not. Brin made those comments in January 2017! And that was more than a year after Sundar Pichai declared that Google was an AI-first company when he first became CEO of the company in 2015.
For a company that saw the fundamental importance of AI more than six years before the launch of ChatGPT, you would think that AI would be the company’s north star. Therefore, it’s surprising that it has repeatedly found itself forced to play catch-up with where the market was going. Then again, it’s always managed to catch up. Maybe they just recognize that the race is much more than a sprint.
The company reports earnings tonight after the close, and the stock has had a relatively rough go heading into the report with a decline of more than 10% from its peak. Just last week, the stock tried to get back above its 50-DMA, but the Bloomberg story stopped that rally right in its tracks, and now the stock is as directionless as the market’s view of the company’s strategy with respect to the launch of its long-awaited Gemini 3.5 model. In the long run, it’s never paid to bet against Google, and tonight’s earnings report could go a long way in telling investors if that’s still the case.
Start a two-week trial to Bespoke Premium to continue reading today’s full Morning Lineup.
The Closer – Earnings, NVDA Investments, Hiring Slowdown – 7/21/26
Log-in here if you’re a member with access to the Closer.
- The earnings slate remains busy with credit card lenders, regional banks, airlines, and jetliner manufacturers all out with results today.
- Recent investments in AI companies that Nvidia (NVDA) has made have offered handsome returns that have even outpaced NVDA itself.
- Albeit still firmly positive, weekly ADP job growth has been decelerating.
See today’s full post-market Closer and everything else Bespoke publishes by starting a 14-day trial to Bespoke Institutional today!
Daily Sector Snapshot — 7/21/26
Q2 2026 Earnings Conference Call Recaps: 3M (MMM)
Bespoke’s Conference Call Recaps use AI to summarize lengthy earnings calls. The commentary below is AI-generated and then edited by Bespoke for quality control. As always, none of these summaries should be construed as recommendations to buy or sell any securities, and investors should do their own research and/or consult with a financial professional before making any investment decisions.
Our latest recap available to Bespoke subscribers covers 3M’s (MMM) Q2 2026 earnings call.
![]()
3M (MMM) is a diversified manufacturer whose material-science technologies support products for factories, electrical infrastructure, transportation, electronics, workplace safety, and consumers. 3M delivered 5.4% organic growth, a record 24.9% adjusted operating margin, and 11% EPS growth. Management attributed the outperformance primarily to internal execution, including better salesforce productivity, cross-selling, and a 200-basis-point improvement in customer attrition. The company launched 92 products during the quarter and expects more than 350 this year. Industrial adhesives, electrical markets, abrasives, safety, aerospace, semiconductors, and data centers were strong, while consumer electronics and auto remained soft. 3M’s Microsoft-backed Expanded Beam Optics technology could become a meaningful AI infrastructure business, with the market projected to reach $2 billion by 2028. Pricing is expected to offset $150 million to $175 million of oil-related inflation, while tariffs remain an additional headwind. With a triple play this quarter, shares rallied 7% on 7/21…
Continue reading our Conference Call Recap for MMM by becoming a Bespoke Institutional subscriber. You can sign up for Bespoke Institutional now and receive a 14-day trial to read our newest Conference Call Recap. To sign up, choose either the monthly or annual checkout link below:
Q2 2026 Earnings Conference Call Recaps: Hasbro (HAS)
Bespoke’s Conference Call Recaps use AI to summarize lengthy earnings calls. The commentary below is AI-generated and then edited by Bespoke for quality control. As always, none of these summaries should be construed as recommendations to buy or sell any securities, and investors should do their own research and/or consult with a financial professional before making any investment decisions.
Our latest recap available to Bespoke subscribers covers Hasbro’s (HAS) Q2 2026 earnings call.
![]()
Hasbro (HAS) is a global games, entertainment, and toy company behind brands including Monopoly, Play-Doh, Peppa Pig, Dungeons & Dragons (D&D), and Magic: The Gathering, its collectible tabletop and digital card game with more than 50 million plays. First-half revenue rose 15%, led by 34% growth at Magic within Wizards, Hasbro’s gaming division that houses Magic and Dungeons & Dragons. Consumer Products (CP), the traditional toy and game segment, also grew despite oil-related input-cost and trade-policy pressure. Management emphasized GEM2 (gamified, entertainment-driven, multi-purchase, and multi-generational categories), which target “kidults,” or adults who buy toys, games, and collectibles for themselves, and continue to outperform the broader toy industry. Hasbro raised its 2026 outlook but remains cautious about holiday demand. It also recorded a $56 million impairment after canceling lower-conviction video games; 2026 should mark peak digital investment, with spending expected to decline at least 25% annually by 2028. On better-than-expected EPS and revenue, HAS shares were up as much as 12.5% on 7/21…
Continue reading our Conference Call Recap for HAS by becoming a Bespoke Institutional subscriber. You can sign up for Bespoke Institutional now and receive a 14-day trial to read our newest Conference Call Recap. To sign up, choose either the monthly or annual checkout link below:
Q2 2026 Earnings Conference Call Recaps: Charles Schwab (SCHW)
Bespoke’s Conference Call Recaps use AI to summarize lengthy earnings calls. The commentary below is AI-generated and then edited by Bespoke for quality control. As always, none of these summaries should be construed as recommendations to buy or sell any securities, and investors should do their own research and/or consult with a financial professional before making any investment decisions.
Our latest recap available to Bespoke subscribers covers Charles Schwab’s (SCHW) Q2 2026 earnings call.
![]()
Charles Schwab (SCHW) is a financial services company serving individual investors and registered investment advisors through brokerage, trading, wealth management, banking, lending, and custody services. Schwab executes roughly one-third of retail brokerage trades, a scale that supports low costs while giving it a large base of self-directed clients to convert into advice, lending, and other services. The company reported record second-quarter results as revenue rose 21% to $7.1 billion and adjusted EPS increased 42% to $1.62. Core net new assets reached $120 billion, trading revenue climbed 28%, managed-investing flows rose 53%, and bank loans grew 33% to $67 billion. Management expects elevated trading activity to remain structurally supported by younger investors, options adoption, AI, and market volatility. Pledged asset lines are gaining traction among wealthy clients reluctant to realize capital gains, while tax-aware long/short strategies are attracting RIAs and concentrated shareholders. Schwab also sees substantial runway in paid advice, used by only 5% of its retail households, and is expanding into AI-enabled service, crypto transfers, private markets, and tokenized securities. SCHW shares opened 1.6% higher on 7/21 after posting better-than-expected results, but intraday performance was shakier…
Continue reading our Conference Call Recap for SCHW by becoming a Bespoke Institutional subscriber. You can sign up for Bespoke Institutional now and receive a 14-day trial to read our newest Conference Call Recap. To sign up, choose either the monthly or annual checkout link below:
Credit & Business Applications Sit Strong
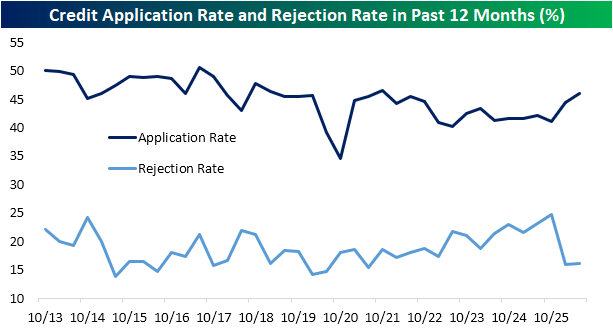
Yesterday, the New York Federal Reserve Bank published the results of their Credit Access Survey. This module of the monthly Survey of Consumer Expectations is fielded every four months with the latest data for the month of June, which we first covered in last night’s Closer.
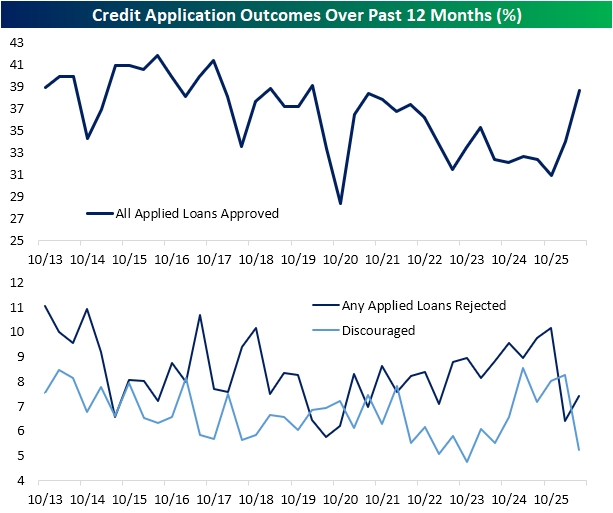
The report showed an overall healthy picture for consumer demand for credit as application rates picked up to 46.1% in June, which was the strongest reading since October 2021 (remember the first rake hikes coming out of the pandemic were five months later in March 2022). Although consumers were more eager to apply, the rejection rate among applicants was little changed at 16.1%.
Approvals for all loans applied to surged to 38.6% versus a recent low of 30.9% last October. That is now the highest since February 2020. Further, the share of respondents reporting discouragement from applying fell to 5.22%, the lowest since October 2023.
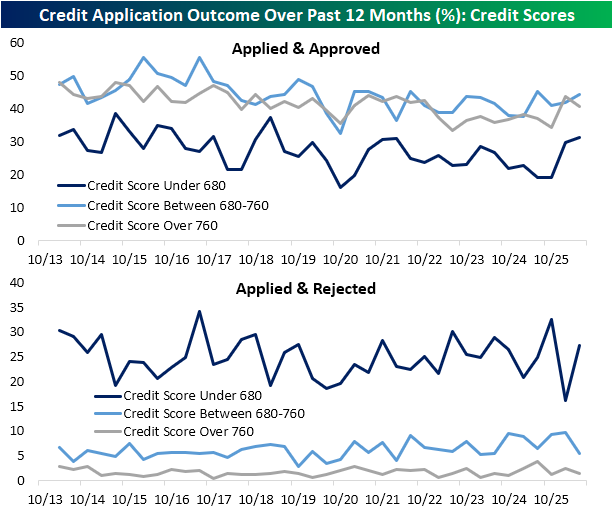
As for who is being approved or rejected, below we show approval and rejection rates for those consumers who applied for a form of credit based upon their credit scores.
As shown, approvals improved for the middle and low credit score brackets, whereas high credit score consumers actually saw lower approvals. In fact, lower credit score approvals came in at the strongest rate since February 2019. Granted, rejections were also higher albeit that is only back to the middle of the historical range versus a series low the prior report.
Despite weakness in various sentiment surveys over the past few years, consumers still appear to view the US economy as healthy enough to not only take on credit, but also start businesses.
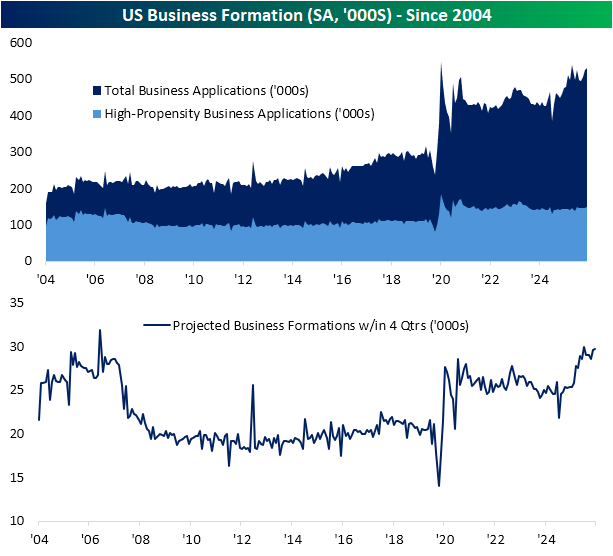
As shown below, business formation data from the Census released earlier this month showed business applications rising in each of the past three months.
At 531K, it has only been higher twice: most recently in November 2025 and the all-time peak in July 2020.
Further, expected business formations (Census estimates of the number of firms that will have payroll tax liabilities in the next four quarters based upon total business applications) have also risen and are in the 99th percentile of readings.
Additionally, applications for “high-propensity to hire” firms are likewise in the top decile of their historical range.
Want more from Bespoke? You can start by joining our Think BIG mailing list where you’ll receive an interesting market stat in your inbox a few times per week. All we need is your email address. Join now by clicking here or on the image below.
