Bespoke’s Morning Lineup – 4/7/26 – Taco Tuesday?
See what’s driving market performance around the world in today’s Morning Lineup. Bespoke’s Morning Lineup is the best way to start your trading day. Read it now by starting a two-week trial to Bespoke Premium. CLICK HERE to learn more and start your trial.
“The secret of life is to say yes all the time, because when you’re old, you don’t want to say, ‘I wish I’d done this, I wish I had done that.” – Francis Ford Coppola

Below is a snippet of commentary from today’s Morning Lineup. Start a two-week trial to Bespoke Premium to view the full report.
It’s been an up-and-down night and morning for equities. moving from negative to positive and back to negative levels. Barring any movement on the diplomatic front, it’s going to be hard for investors to take on much risk ahead of the President’s 8 PM deadline for Iran to reopen the Strait or face the wrath of the US military. At no time would a Taco Tuesday be more welcome than today, but the President has shown no signs of backing down. His latest Truth Social post comments from just a few minutes ago threaten that a “whole civilization will die tonight, never to be brought back again.” That is, unless “something revolutionary wonderful can happen”.
Besides the weakness in equity futures, Treasury yields are little changed, crude oil is up over 3%, gold is remarkably unchanged, and Bitcoin is down 2%.
Japanese stocks reopened from the long holiday weekend and finished the day effectively unchanged, while Hong Kong remained closed. Chinese stocks had marginal gains while South Korea and Australia were up close to 1% or more. With the Strait of Hormuz remaining closed, concerns have grown over the availability of not just energy, but also helium supplies for South Korea’s chip industry. Officials announced last night, though, that the country’s chip assemblers have secured supplies of at least four months.
In Europe, we’re seeing a modestly positive start to the week after the four-day weekend. Service sector PMIs for the continent declined slightly less than expected, while it was a mixed bag at the individual country level. France and Italy are leading in early trading with gains of about 0.5%, while Germany is unchanged.
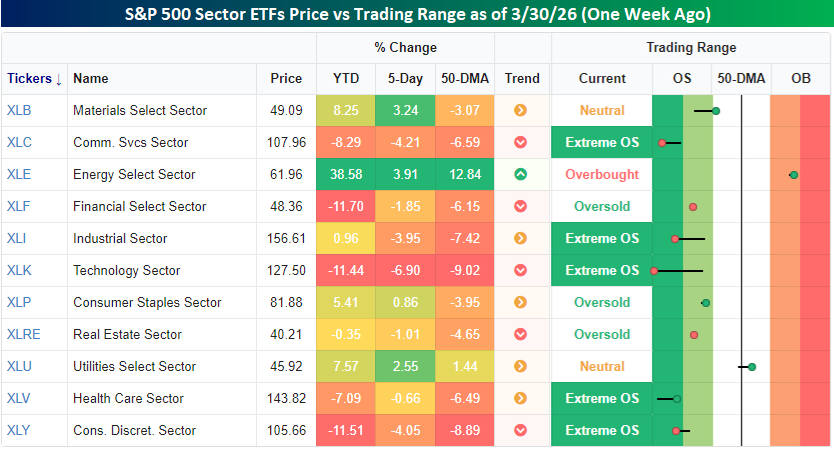
US stocks have made a nice comeback over the last year, moving from an environment where most sectors were either oversold or extremely oversold to one where most sectors are back to neutral. Starting with where things stood last week at this time, most sectors had declined over the prior week with several, like Technology, Communication Services, and Consumer Discretionary, experiencing declines of more than 4%. Those declines also put all three sectors into extreme oversold territory along with Industrials and Health Care. The only sectors above their 50-DMAs were Energy (which was overbought) and Utilities.
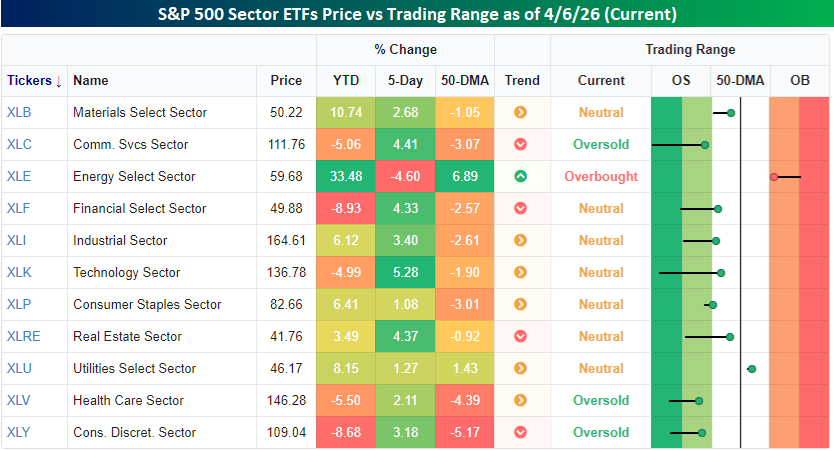
With the S&P 500 up four days in a row since the snapshot above was taken, we’ve seen a mass exodus out of oversold territory. The only sector down over the last week is Energy, while every other sector is up at least 1%, including four with gains of more than 4%. While three sectors – Communication Services, Health Care, and Consumer Discretionary – remain in oversold territory, they’re all close to moving out. That said, Energy and Utilities are still the only two sectors above their 50-DMAs, so there’s still plenty of room for improvement.
Like most sectors, the S&P 500 also managed to move out of oversold territory yesterday (light blue shaded region), an area it has been in since early March.
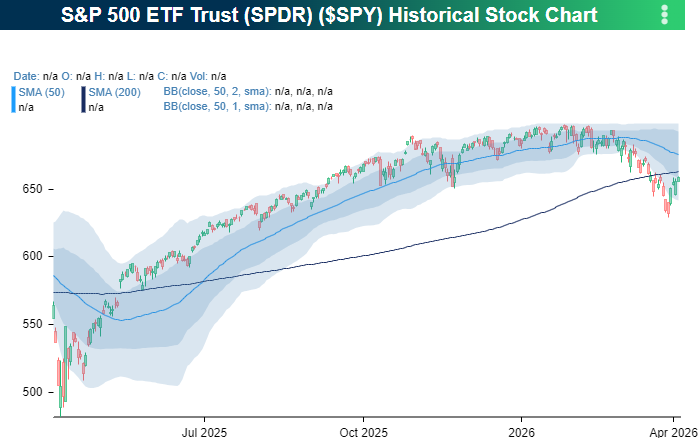
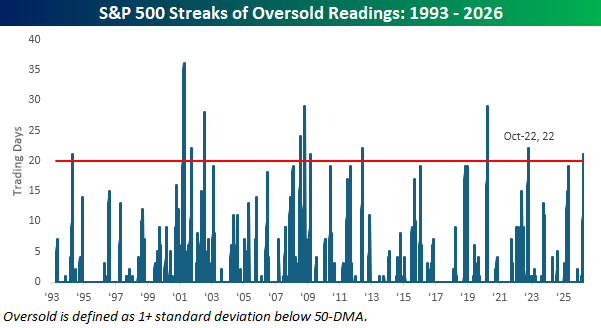
In fact, yesterday’s rally ended a streak of 21 trading days where SPY closed in oversold territory. That was the longest streak since the one that ended the bear market in October 2022, and it was only one of eleven streaks in SPY’s history since 1993 that lasted four weeks or more. The longest of these streaks was 36 trading days ending in April 2001, and eight lasted longer than 21 days.
The Closer – Cyclicals Technically Better, Backwardation – 4/6/26
Log-in here if you’re a member with access to the Closer.
- Some cyclical parts of the market have seen technicals improve following the past few days’ rally.
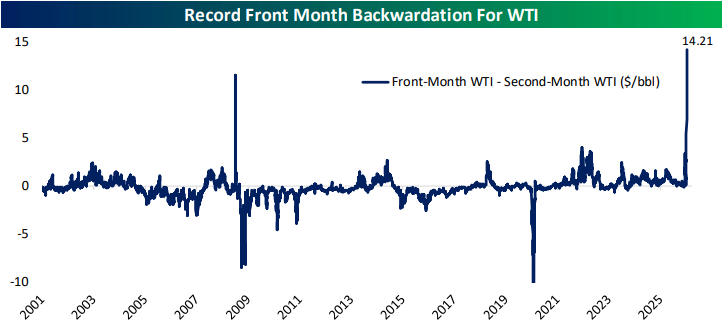
- Front-month WTI reached a new cycle high today; resulting in a record spread between front and second month prices.
- The share of mortgage loans seriously delinquent and in foreclosure reached multi-year highs in February.
See today’s full post-market Closer and everything else Bespoke publishes by starting a 14-day trial to Bespoke Institutional today!
Daily Sector Snapshot — 4/6/26
Chart of the Day: You Can’t Spell Iran Without AI
Bespoke’s Morning Lineup – Nothing to See Here
See what’s driving market performance around the world in today’s Morning Lineup. Bespoke’s Morning Lineup is the best way to start your trading day. Read it now by starting a two-week trial to Bespoke Premium. CLICK HERE to learn more and start your trial.
“It is the obvious which is so difficult to see most of the time.” ― Isaac Asimov
Below is a snippet of commentary from today’s Morning Lineup. Start a two-week trial to Bespoke Premium to view the full report.
After opening firmly lower last night, equity futures gained steam overnight on hopes of a ceasefire in the Iran war. After Iranian officials refuted those reports, though, we’re basically back to the unchanged line. It could be worse!
Following last Friday’s better-than-expected jobs report, treasury yields are modestly higher, with the 10-year yield at 4.36%. In commodity markets, crude oil is surprisingly contained at a decline of less than 1%, although that could change as reports surface that Israel launched strikes on Iran’s largest petrochemical facility. Gold prices are fractionally higher at just under $4,700 per ounce, and Bitcoin is up a healthy 3% and making a run back towards $70K.
It was a positive start to the week in Asia, even as China and Australia were closed. Japanese markets rallied 0.6%, while South Korea gained 1.4%. In Europe, markets are all closed, so there’s little economic or market data for investors to react to, leaving plenty of room for investors to focus their attention on Iran and the energy markets.
In the US today, the only report on the calendar is ISM Manufacturing at 10 AM. Economists expect the headline reading to pull back from 56.1 to 54.9.
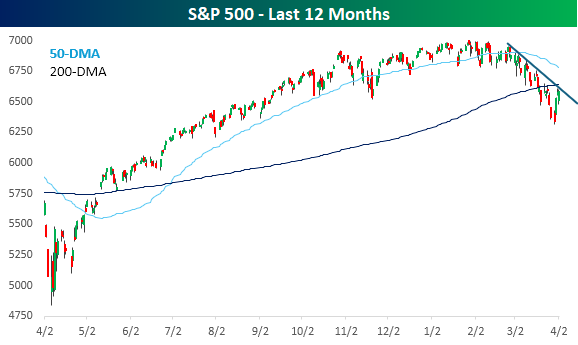
Even though it was a short one, last week’s gains were enough to make it the best weekly performance of the year. Bulls will take gains whenever and wherever they can, but the rally, at this point, has done little to break the overall trend that has been in place for the last several weeks. The S&P 500 remains below the 200-DMA, and the downtrend remains intact. Whether the rally is a dead cat bounce or the real thing, it has to start somewhere, and only time will tell. At this point, though, bulls will need to see more improvement before starting to feel more confident.
As mentioned above, many international markets are still closed for the Easter holiday, so we wanted to see what seasonal headwinds or tailwinds the Easter holiday has historically had on the market. The chart below shows the S&P 500’s performance in the week after Easter for every year since 1945. Overall, the S&P 500 has averaged a 0.2% gain during Easter week with positive returns 59% of the time, but most years have been anything but average. Look no further than last year when the S&P 500 rallied 4.6% for its second-best Easter week performance, trailing only the 5.0% gain in 2001.
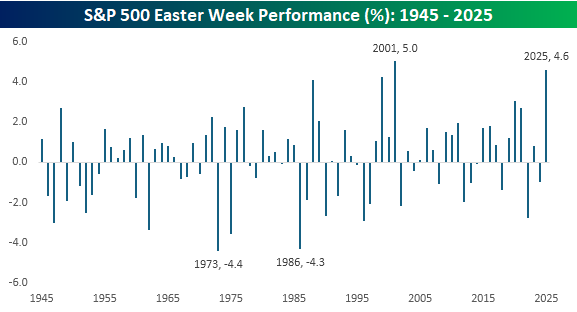
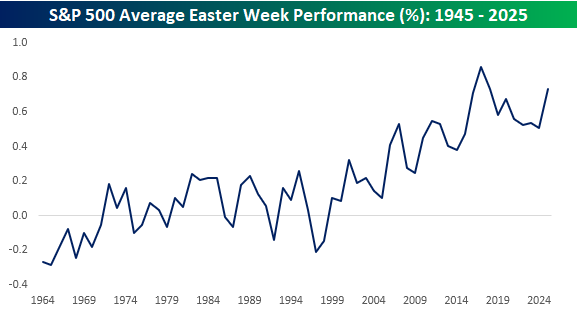
Looking at the chart above, you can see that performance around Easter week has been better more recently than in the years immediately after WWII, with fewer large declines during the Easter week. The chart below shows the 20-year average of the S&P 500’s Easter week performance since 1964, and clearly shows the improving trend. In 1964, the 20-year average performance was negative, but it has steadily increased over time, especially over the last 25 years. The 20-year average peaked in 2017 at 0.9%, but at 0.7% now, it’s the third-best reading of any since 1964, trailing only the readings in 2017 and 2018.
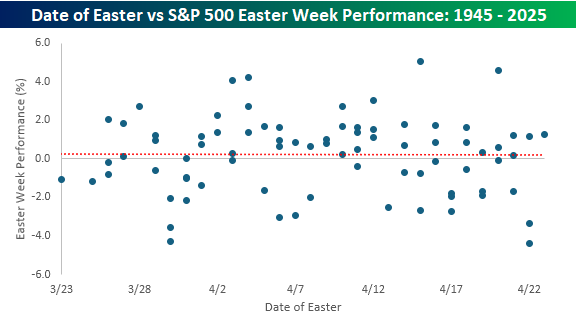
Unlike most other holidays, which fall on a specific date or particular point on the calendar, Easter can fall anywhere from late March to late April. Given Easter’s floating nature, we were curious to see if there was any correlation between the market’s performance during Easter week and when it falls on the calendar. The scatterplot below shows the date of every Easter since 1945 and the S&P 500’s performance during Easter. As shown, while Easter week performance has improved over time, there is zero correlation between performance and when Easter falls on the calendar. Nothing to see here.
Brunch Reads – 4/5/26
Welcome to Bespoke Brunch Reads — a linkfest of some of our favorite articles over the past week. The links are mostly market-related, but there are some other interesting subjects covered as well. We hope you enjoy the food for thought as a supplement to the research we provide you during the week.
Dum Dum, Give Me Gum Gum: The remote Pacific island now known as Easter Island was first “discovered” by Europeans on April 5, 1722, when Dutch navigator Jacob Roggeveen sighted its shores during an expedition in search of Terra Australis. The date coincided with Easter Sunday, which inspired the island’s enduring Western name. What Roggeveen and his crew encountered was both a treeless landscape dotted with towering stone figures, later called moai, standing along the coast.
Accounts describe confusion between the Europeans and the island’s inhabitants, the Rapa Nui people, whose culture had already developed in isolation for centuries. The explorers were astonished by the scale and number of the statues, some weighing dozens of tons, carved from volcanic rock and transported across the island with methods still debated today. Despite the grandeur of these monuments, the island appeared sparsely resourced. That puzzled the Europeans as to how such a society sustained itself.
Still, there are conflicting theories about what happened to the people who inhabited the small, remote island. One version tells us that Rapa Nui became severely overpopulated, and after exhausting resources, the population collapsed to just a few thousand by the time the Europeans arrived. Another version says that the island only grew enough crops to feed a small number of people, as evidenced by calculated agricultural “rock garden” productivity, meaning the population could have never gotten out of control. As interesting as it is to do a little research on at home, it is perhaps just as entertaining to see the Moai featured in the movie Night at the Museum!

AI & Technology
AI Adoption and Firms’ Job-Posting Behavior (Federal Reserve)
AI adoption is rising quickly, but there’s little evidence so far that it’s reducing overall hiring, with job postings holding steady or even ticking slightly higher in AI-heavy firms. The bigger changes are happening beneath the surface, where some roles are changing or disappearing while others expand, and the long-term impact is still unclear. [Link]
Continue reading our weekly Brunch Reads linkfest by logging in if you’re already a member or signing up for a trial to one of our two membership levels shown below! You can cancel at any time.

The Closer – AI Eats Trades, Mortgage Rates, Oil – 4/2/26
Log-in here if you’re a member with access to the Closer.
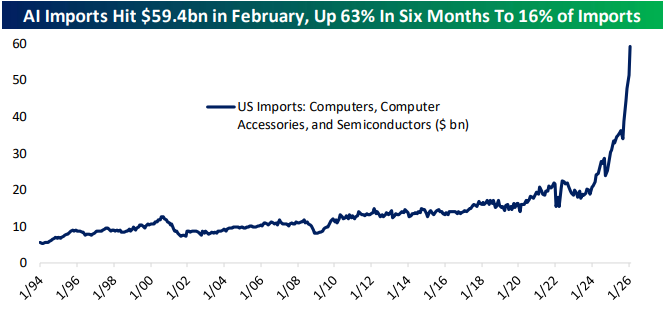
- Imports of categories related to AI spend are going absolutely gangbusters with total import bill of just below $60 billion in February, up 63% in six months.
- Our Salient Price Stress Index combining impacts of mortgage rates and gas prices is up 5.9% over the past few months.
- Spot Brent trades for cargoes loaded in the near-term rose above their 2008 nominal peak to close at a record $141.37/barrel.
See today’s full post-market Closer and everything else Bespoke publishes by starting a 14-day trial to Bespoke Institutional today!
Bespoke’s Weekly Sector Snapshot — 4/2/26
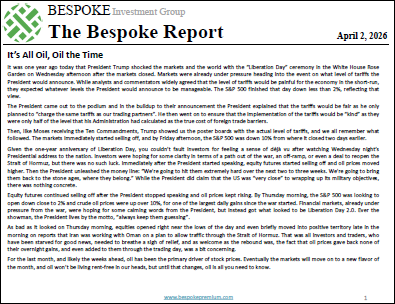
The Bespoke Report – 4/2/26 – It’s All Oil, Oil the Time
To read our weekly Bespoke Report newsletter and access everything else Bespoke’s research platform offers, start a two-week trial to Bespoke Premium. This week’s report comes a day early as the market is closed in observance of Good Friday. In this week’s report, we cover the market’s handcuff to oil prices, market performance during Q1, the extraordinary moves in the Energy sector, economic data since the war started, seasonality, and much more.

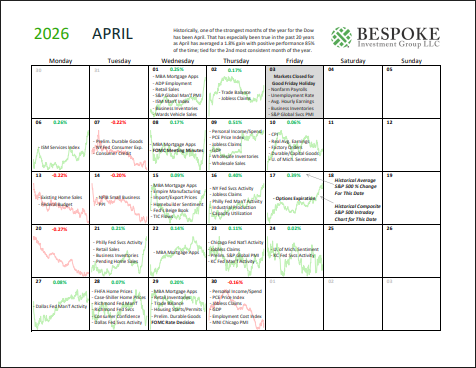
Bespoke Market Calendar — April 2026
Please click the image below to view our April 2026 market calendar. This calendar includes the S&P 500’s historical average percentage change and average intraday chart pattern for each trading day during the upcoming month. It also includes market holidays and options expiration dates plus the dates of key economic indicator releases.Click here to view Bespoke’s premium membership options.