
Q2 2026 Earnings Conference Call Recaps: Alphabet (GOOGL)
Bespoke’s Conference Call Recaps use AI to summarize lengthy earnings calls. The commentary below is AI-generated and then edited by Bespoke for quality control. As always, none of these summaries should be construed as recommendations to buy or sell any securities, and investors should do their own research and/or consult with a financial professional before making any investment decisions.
Our latest recap available to Bespoke subscribers covers Alphabet’s (GOOGL) Q2 2026 earnings call.

Alphabet (GOOGL) is the parent of Google, whose businesses include Search, YouTube, Android, Google Cloud, advertising, subscriptions, devices, and Waymo. Its latest growth is increasingly tied to Gemini, which is expanding search activity, improving advertising performance, and driving enterprise demand for AI infrastructure and software. Alphabet’s AI spending is beginning to produce measurable returns. Revenue rose 24%, including 17% Search growth and 82% Cloud growth, while Cloud backlog reached $514 billion and operating margin expanded to 35.6%. AI Mode surpassed 1 billion monthly users, Gemini reached 950 million, and AI Max users are generating 15% more conversions or value at similar returns. Demand remains greater than available compute, prompting Alphabet to raise 2026 CapEx guidance to $195–$205 billion and use higher-cost third-party capacity until internal supply catches up. Management acknowledged that Gemini needs improvement in agentic coding but expects faster model releases and is undertaking its largest pre-training run yet for Gemini 4. TPU system sales also began in Q2 and should ramp substantially in 2027. Despite better-than-expected results, GOOGL shares fell as much as 7.5% on 7/23 after announcing big AI spending plans…
Continue reading our Conference Call Recap for GOOGL by becoming a Bespoke Institutional subscriber. You can sign up for Bespoke Institutional now and receive a 14-day trial to read our newest Conference Call Recap. To sign up, choose either the monthly or annual checkout link below:
Bespoke’s Weekly Sector Snapshot — 7/23/26
Bullish Sentiment Starting to Swing
Despite a one-day rebound on Tuesday, most of the past week has seen declines in the S&P 500. Although the drop isn’t particularly severe (currently the index is only down to the lowest levels since June 26th), sentiment has taken a sizable hit. The weekly sentiment survey from the American Association of Individual Investors, or AAII, fell sharply from one of the higher readings of the year to the lowest. As shown below, last week the percentage of survey respondents reporting they believed the S&P 500 would move higher in the next six months came in at 44.9%, tying the reading from three weeks prior for the most elevated level of bullishness since the week of April 23rd (46%). One week later, that dropped to 29.6%, which is the weakest investor sentiment reading since the second week of last September.
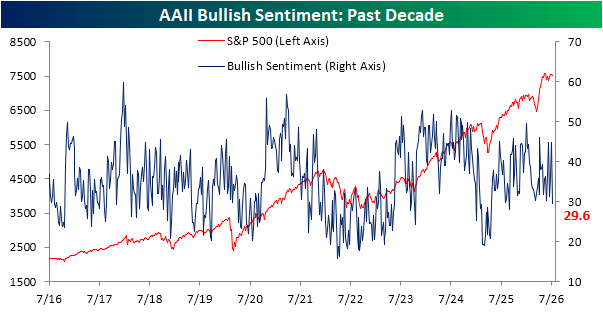
Although there have been some big swings in recent weeks, the actual level of bullish sentiment has been remarkably range-bound recently. For context, since the survey began in 1987, bullish sentiment has been between 30% and 50% about 65% of the time, with an average reading of 37.6% across all weeks. While readings between 30% and 50% are the most common, they have also been consistent over the past year. With this week’s fall back below 30%, a historic streak has ended.
As shown below, before this latest sub-30% reading, bullish sentiment came in between 30% and 50% for 44 consecutive weeks. That is by far the longest stretch on record and far surpassed the previous records of 30 straight weeks ending in 1995 and 1998.
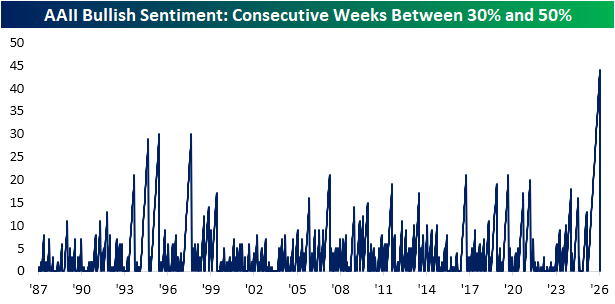
Not only has bullish sentiment sat in a “normal” range for a historic stretch, but elevated bullish sentiment readings have been hard to come by lately. Since the 2020s began, the highest bullish sentiment reading achieved was 56.9% in April 2021. Furthermore, bullish sentiment hasn’t registered a reading above 60% since 2010, whereas there were 44 weeks with readings above that level from 1990 through 2010. Conversely, the lowest it has fallen in the 2020s was readings around 15% in April 2022 and a more recent sub-20% reading in early spring 2025. In other words, bullish sentiment has had more downside than upside this decade.
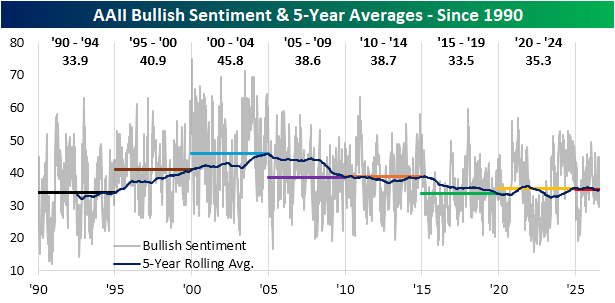
There is some necessary context to this pattern, though. From the start of the survey in 1987 through the mid-2000s, bullish sentiment was generally trending higher on a 5-year rolling basis. However, since around 2005, that has changed to a secular downtrend. Shown a different way, using average readings across five-year periods, sentiment has been little changed over the past decade, and those readings are considerably lower than what was observed in the early 2000s and late1990s.
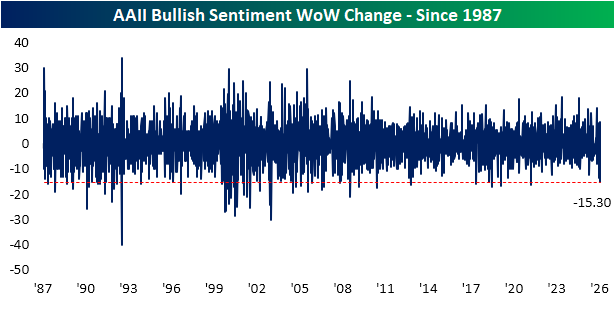
Pivoting back to the most recent week’s data, the 15.3 percentage point drop was large. It was the biggest one-week decline in bulls since a 16.5 percentage point decline in September 2021, and that also ranks in the 2nd percentile of all weekly moves since the start of the survey.
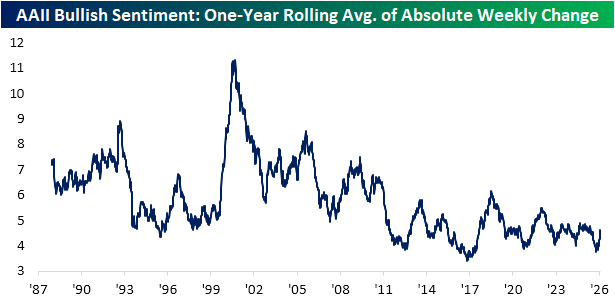
Again, as a testament to the stability of sentiment, below we show the rolling one-year average absolute weekly change in bullishness since the start of the survey. As with the actual level of bullishness, this line has generally trended lower over time, meaning week-to-week fluctuations are less volatile now than they were in years past. With that said, that downtrend has flattened out some in the past decade.
Looking more recently, there was a low of 3.75 percentage points achieved in early April, the lowest reading since November 2017 and a first percentile reading for the full survey history. In the three months since then, the reading has rebounded (meaning sentiment has gotten more volatile), but even at the current level of 4.63 percentage points, it remains in the bottom quartile of readings historically.
Want more from Bespoke? You can start by joining our Think BIG mailing list where you’ll receive an interesting market stat in your inbox a few times per week. All we need is your email address. Join now by clicking here or on the image below.

Green Across the Grid
The S&P 500 Utilities sector had its best day since April 30th yesterday, rallying 2.29%. All 31 constituents finished higher, giving the sector a perfect breadth day. The gain instantly took the sector from trading 0.21 standard deviations above its 50-DMA to the most overbought sector in the S&P 500, 1.49 standard deviations above its 50-DMA.
Over the last five years, the Utilities sector has recorded 24 days when it rallied 2%+ with perfect breadth. Most were concentrated in the first half of the chart below, while only four have occurred since the start of 2024. Yesterday’s 2.29% rally was also smaller than the average gain of 3.44% on these days since 1990. The largest came on 10/13/08, when the sector soared 13.52% for its biggest one-day gain since at least 1990.
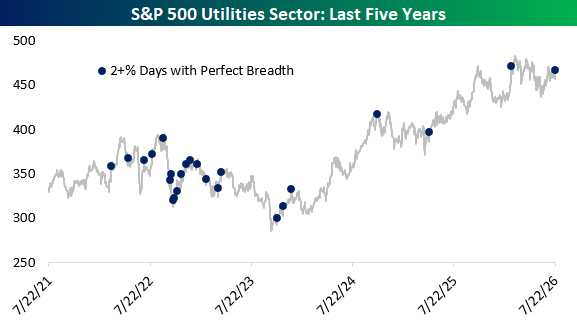
As this has become an increasingly rare occurrence for Utilities, yesterday was just the sector’s third perfect breadth day this year. It’s the second most of any sector this year, yet still below Energy with 5 perfect breadth days. Energy (+31.9%) is currently the top-performing sector of 2026, while Utilities (+7.6%) is the seventh-best, in the bottom half.
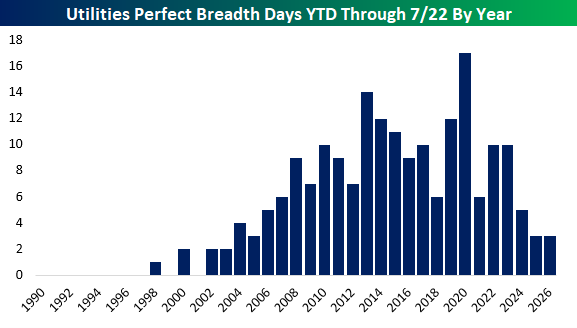
Three perfect breadth days through July 22nd is historically low for Utilities. The sector also recorded three through the same point last year, but before that, no year had so few since 2005. The total reached 17 in 2020, while the average since 1990 is five through this point in the year.
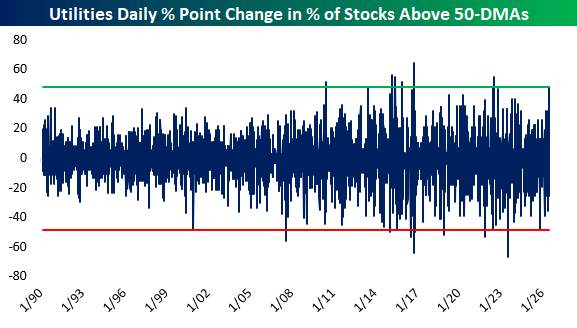
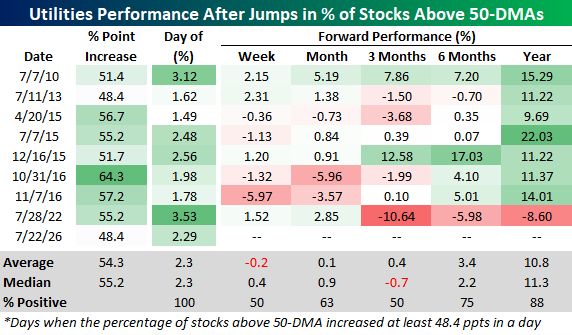
Utilities also saw an unusually large expansion in the percentage of stocks above their 50-DMAs yesterday. That reading nearly doubled from 48.4% to 96.8%, an increase of 48.4 percentage points. Since 1990, only eight other days have produced an increase that large, all occurring since 2010. Moves of similar magnitude in the opposite direction have been nearly as rare, with only eleven days clocking a larger one-day decline.
As detailed in the table below, prior jumps of at least 48.4 percentage points in the share of Utilities stocks above their 50-DMAs haven’t provided much of an immediate tailwind. The sector averaged a decline of 0.2% over the next week and was higher only half the time three months later. Longer-term performance was more consistent, however, with the sector gaining an average of 3.4% over the next six months and 10.8% over the next year. The sector was also higher one year later following seven of the eight prior occurrences.
You can find more sector research like this in Bespoke’s Daily Sector Snapshot.
Read about Bespoke’s premium membership options to find out how to receive our Sector Snapshot in your inbox daily.
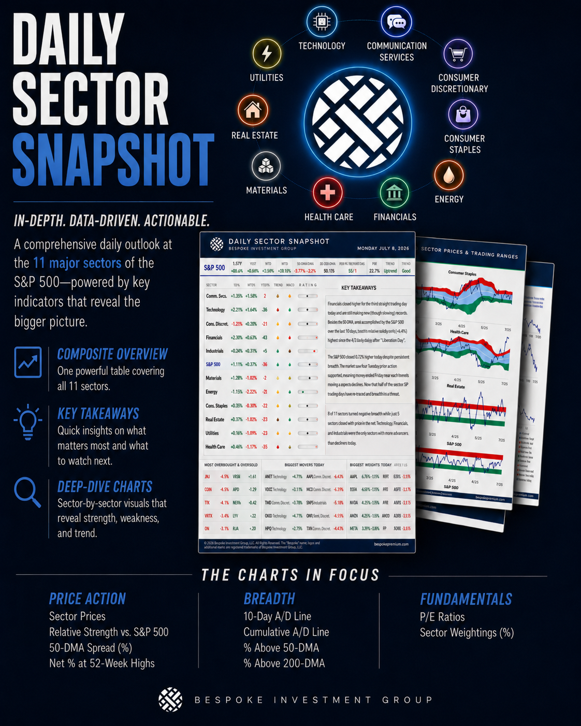
Chart of the Day: EUREVving Up!
Bespoke’s Morning Lineup – 7/23/26 – Back to $90
See what’s driving market performance around the world in today’s Morning Lineup. Bespoke’s Morning Lineup is the best way to start your trading day. Read it now by starting a two-week trial to Bespoke Premium. CLICK HERE to learn more and start your trial.
“No one expects the rug to be yanked out from underneath them; life-changing events usually don’t announce themselves.” – Slash

Below is a snippet of commentary from today’s Morning Lineup. Start a two-week trial to Bespoke Premium to view the full report.
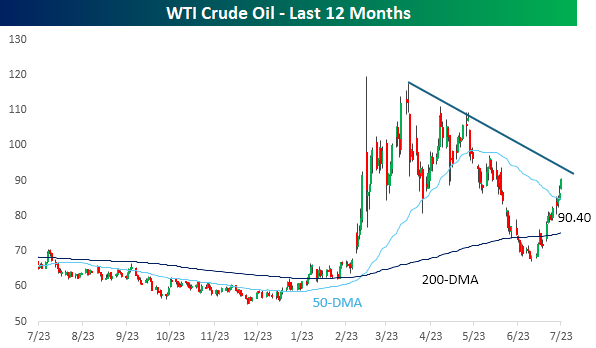
Equity futures have been getting progressively weaker as the morning goes on, and the major averages are now on pace for sizable declines. The Dow and S&P 500 are both indicated to open 0.6% lower while the Nasdaq stares at a loss of 0.80%. Treasury yields continue to march higher unabated, with the 10-year yield up more than 0.4% to 4.7%. The rise in yields has been driven by crude oil prices, which are up over 4% with WTI trading back above $90 per barrel. Gold is down more than 1.5%, and Bitcoin is 0.6% lower but still above $65K.
In Asia, South Korea regained most of the losses from late in Wednesday’s session overnight and finished the day up 4.4%. Other major benchmarks in the region were also mostly higher, as India was the main outlier, falling 0.5%. South Korea’s GDP for the second quarter came in stronger than expected, rising at a rate of 0.6% q/q compared to forecasts for an increase of 0.4%.
European stocks are lower across the board, taking their cue more directly from the rise in oil prices. The STOXX 600 is down 0.7% as Italy and France lead the declines with losses of over 1%. As expected, the ECB left rates unchanged, but President Lagarde’s comments will be scrutinized for signs of a potential hike in September.
It’s been a quiet week for data so far, but this morning jobless claims hit the tape at 8:30. Initial claims dropped to 187K, which was the lowest level since September 1969, and continuing claims also fell below 1.8 million for the first time since May. Besides these two reports, the KC Fed Manufacturing report will come out at 11 AM. While not an economic report, the latest sentiment survey from AAII showed a large drop in optimism as bullish sentiment dropped below 30% for the first time since September.
While shares of Alphabet (GOOGL) haven’t helped the overall tone in futures with its decline of over 4%, rising crude oil prices are also weighing heavily on pre-market sentiment. After falling below $70 per barrel in late June and earlier this month, as mentioned above, WTI crude oil prices are surging more than 4% this morning and trading back above $90 per barrel. While the decline earlier this summer provided some relief to markets, investors are going to have to rethink some of their assumptions regarding the economy and the Fed if $90 becomes the new normal.
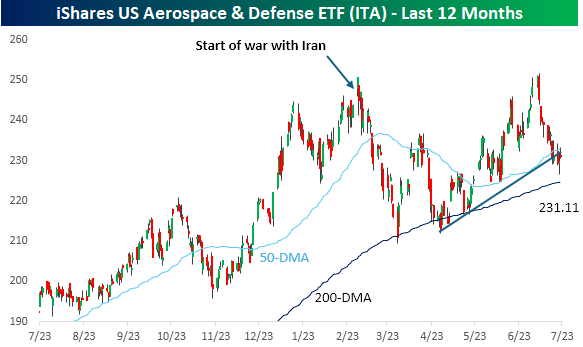
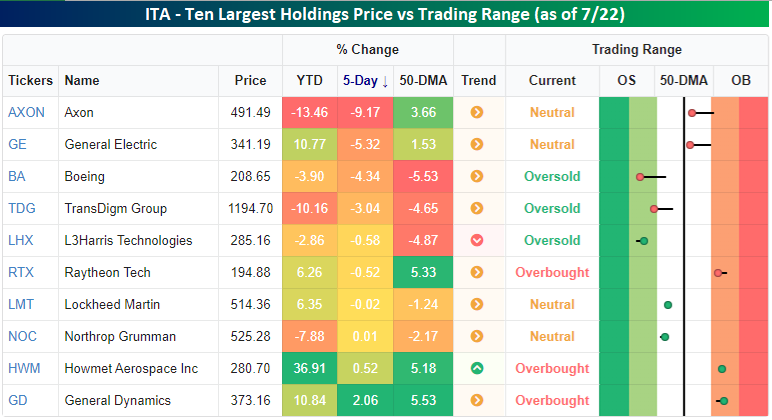
Rising tensions in the Middle East have been the obvious driver of the latest leg higher in crude oil prices, so you would think that the defense stocks would also be getting a lift. That hasn’t been the case. In fact, the iShares US Aerospace & Defense ETF (ITA) is barely hanging on to its uptrend line from the April lows, and it remains well off its peak, which literally came on the first day that markets opened after the war started.
A look at the ETF’s 10 largest holdings and their performance this year also shows a weak picture for a sector that couldn’t ask for a better geopolitical environment. Of the ten stocks listed below, only three (HWM, GD, and GE) are outperforming the S&P 500 on a YTD basis while half of them are in the red. Even over the last week, as the conflict has escalated, most of the stocks listed are lower.
Start a two-week trial to Bespoke Premium to continue reading today’s full Morning Lineup.
The Closer – More Momentum, Mega-Cap Earnings, EIA – 7/22/26
Log-in here if you’re a member with access to the Closer.
- Over the past two days, a long-short strategy of the stocks with the most and least momentum has experienced a historic surge.
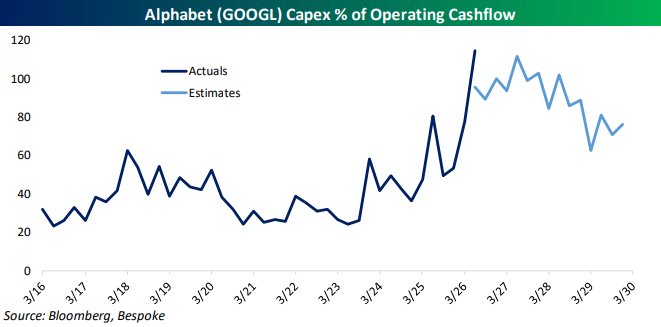
- The first of the mega-caps have now reported with results from Alphabet (GOOGL) and Tesla (TSLA).
- Crude oil inventories continue to reach multi-decade lows while gasoline demand appears to have peaked.
See today’s full post-market Closer and everything else Bespoke publishes by starting a 14-day trial to Bespoke Institutional today!
Daily Sector Snapshot — 7/22/26
Chart of the Day – Large Cap Lag
Q2 2026 Earnings Conference Call Recaps: PulteGroup (PHM)
Bespoke’s Conference Call Recaps use AI to summarize lengthy earnings calls. The commentary below is AI-generated and then edited by Bespoke for quality control. As always, none of these summaries should be construed as recommendations to buy or sell any securities, and investors should do their own research and/or consult with a financial professional before making any investment decisions.
Our latest recap available to Bespoke subscribers covers PulteGroup’s (PHM) Q2 2026 earnings call.

PulteGroup (PHM) is one of the largest US homebuilders, selling entry-level, move-up, and active-adult homes through brands including Pulte Homes, Centex, Del Webb, and Explore by Del Webb. Second-quarter orders rose 6% despite affordability pressures, volatile interest rates, and uneven consumer confidence, with active-adult orders up 12% and Florida orders up 19%. Demand remained strongest in Florida, the Midwest, and parts of the Southeast, while Texas improved and the West remained soft. PHM reduced incentives by 50 basis points sequentially and maintained a 25% gross margin as house costs fell 5% to just under $75 per square foot. The company is moving back toward build-to-order sales, now 45% of orders versus a 60% target, while finished spec inventory declined to 1.3 homes per community. Management remains cautious about elevated incentives and rising lumber and oil costs. PHM shares opened 2.8% higher on 7/22 after beating EPS and revenue estimates…
Continue reading our Conference Call Recap for PHM by becoming a Bespoke Institutional subscriber. You can sign up for Bespoke Institutional now and receive a 14-day trial to read our newest Conference Call Recap. To sign up, choose either the monthly or annual checkout link below: