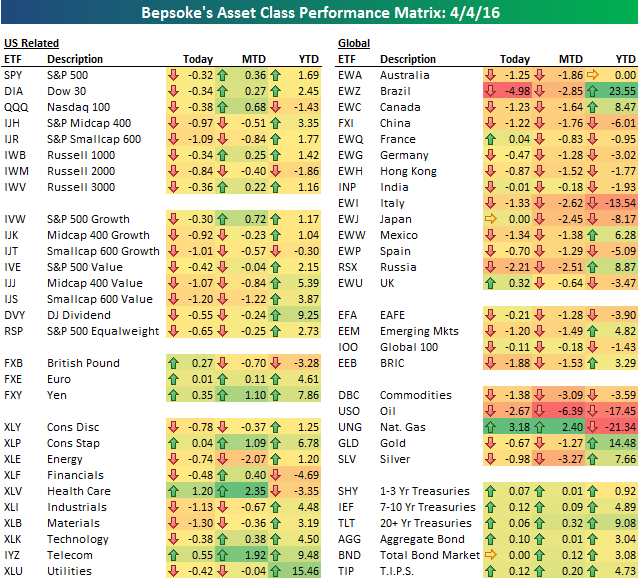
Bespoke’s Asset Class Performance Matrix: 4/4/16
For paid members today, we published a Chart of the Day looking at a strong move recently in the Biotech group. We also published our weekly Stock Seasonality report plus our popular post-market Closer. There’s also still time to check out our Q2 2016 Bespoke Report outlook piece. Choose a membership option at this page to see the report now.
US equity futures were higher before the open this morning, but we saw stocks move into the red quickly after the open and they never made it back into the green. The S&P 500, Dow 30 and Nasdaq 100 were all down roughly 35 basis points, but small-caps (IJR) fell more than 1%. Industrials, Materials, Consumer Discretionary, and Energy led the market lower, while Health Care bucked the trend and actually gained 1.2%.
Outside of the US, the Brazil ETF (EWZ) got walloped by 5%. Oil fell 2.7% while natural gas rose 3%. Treasury bond ETFs gained slightly. Have a good evening — we’ll be back first thing tomorrow AM as usual.
ETF Trends: US Sectors & Groups – 4/4/16
S&P 500 and Oil Diverge
Over the last few months, stocks and oil had been tracking each other very closely. Since late March, however, we’ve seen stocks continue to trend higher even as oil has pulled back. Can stocks keep ticking higher if oil continues to dip? Probably not if oil gets back into the low-$30s or high $20s.
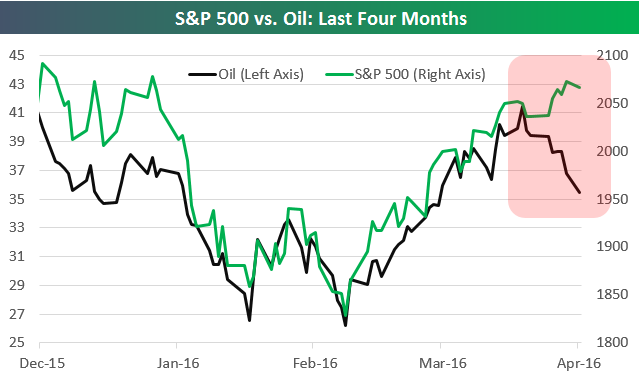
Chart of the Day: Biotech Breakout?
In today’s Chart of the Day, we examine and assess a possible breakout from the biotechs.
To read our Chart of the Day, enter your info below and start a free Bespoke research trial. During your trial, you’ll also receive access to our model stock portfolios, daily market alerts, and weekly Bespoke Report newsletter.
[thrive_leads id=’59052′]
Housing Market Beset By Tight Inventory Conditions
Below is an excerpt from the Housing section of our quarterly outlook report, published last Friday. Sign up for any level of Bespoke subscription to gain access to the full report now, and also get access to our quarterly outlook call and webinar scheduled for this Thursday.
We think the current housing market is badly constrained by a complete lack of inventory. As shown at below left, existing home sales have basically recovered to levels that prevailed in the early 2000s, and they’re doing so with very little inventory. The most recent figures show homes available for sale (chart, middle left) meeting less demand than any month other than the peak of the boom in 2005. This isn’t leading to higher existing home sales because existing home sales are dramatically higher than new starts (incremental supply). As shown in the bottom left chart, there are 6 existing homes sold for every 1 started; still very elevated historically.
Tight supply is less obvious in the new home market (right section below) but what is obvious is that turnover is very fast (i.e. very low time on market) and prices are very high on an absolute dollar basis. While the number of new homes sold every year is still barely one-third of the 2000s peak, price is now 15% higher for the median home. Recently the median time on market for new homes registered an all-time low, and while it bounced in the shoulder season of the calendar we expect that figure to remain well below historical averages given tight supply.

A Reversal of Fortune for 2015’s Losers
 Bespoke has just published its Q2 2016 quarterly outlook piece. Our outlook pieces (both annually and quarterly) cover the ins and outs of everything going on in financial markets, with invaluable insights on valuations, technicals, sentiment measures, seasonality, and more. The report is in-depth, but it’s presented in a way that’s extremely easy for investors to digest. That’s what Bespoke is best known for: analyzing complicated market data with unique charts and graphics that are quick and easy to interpret.
Click here to learn how you can access our Q2 2016 quarterly outlook piece with a 20% membership discount.
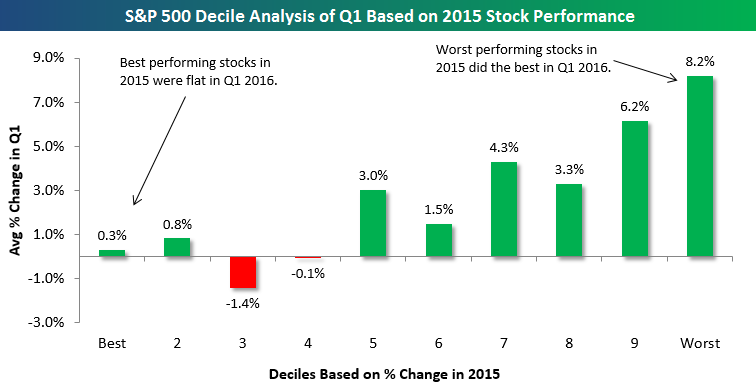
Below is a chart from an analysis we did in our Q2 2016 Bespoke Report outlook piece. The average stock in the S&P 500 gained roughly 2.6% in the first quarter. But which stocks outperformed the market and which ones underperformed? One of the simplest triggers for outperformance in Q1 was how a stock performed in 2015. Basically, the stocks that did well last year saw in-line to sub-par returns in Q1 2016. On the other hand, stocks that fell the most in 2015 ended up rallying the most in Q1.
We highlight this trend in the chart below using our decile analysis. To run the analysis, we break the S&P 500 into deciles (10 groups of 50 stocks each) based on 2015 stock performance. So decile 1 contains the 50 S&P 500 stocks that did the best in 2015, decile 2 contains the next best 50, and so on and so forth until you get to decile 10, which contains the 50 stocks in the S&P that did the worst in 2015. We then find the Q1 2016 return for each stock in each decile, and then we calculate the average Q1 change for all stocks in each decile. The chart below shows these average Q1 returns for stocks by decile.
As shown, the 50 stocks that did the best in 2015 (decile 1 all the way to the left) gained an average of just 0.30% in Q1 2016. Decile 2 saw an average gain of just 0.8%, and then deciles 3 and 4 actually averaged declines. Conversely, the 50 stocks in the S&P that did the worst in 2015 (decile 10 all the way to the right) gained an average of 8.2% in Q1. That’s by far the best average return of any decile. In fact, deciles 5 through 10 all saw better-than-average returns.
With 2015’s biggest losers proving to be the biggest winners in Q1, it’s no surprise that so many fund managers and individual investors underperformed the market.
In our full decile analysis featured in our Q2 2016 outlook piece, we look at the impact that other stock characteristics like valuations, dividend yields, market cap, short interest, analyst ratings, institutional ownership, and international revenue exposure had on performance in the first quarter. We present the analysis in an easy-to-read one-page matrix. To see the analysis, sign up for one of our monthly or annual membership options at this page.
Bespoke Stock Seasonality: 4/4/16
Dynamic Upgrades/Downgrades: 4/4/16
Bespoke Brunch Reads: 4/3/16
Welcome to Bespoke Brunch Reads — a linkfest of the favorite things we read over the past week. The links are mostly market related, but there are some other interesting subjects covered as well. The links are in no particular order. We hope you enjoy the food for thought as a supplement to the research we provide you during the week.
Why We Think We’re Better Investors Than We Are by Gary Belsky (NYT)
A fascinating look at the behavioral economics behind investing and the dangers that overconfidence have for so many investors. [Link]
Good riddance, gig economy: Uber, Ayn Rand and the awesome collapse of Silicon Valley’s dream of destroying your job by Steven Hill (Salon)
We’ll be the first to admit that both the title and content of this piece are a bit heavy-handed, but we think the general point about the “sharing economy” effort to quantize labor and why it likely won’t work beyond a few specific cases are instructive. [Link]
A $700 Juicer for the Kitchen That Caught Silicon Valley’s Eye by David Gelles (NYT)
If you look to it as a sign of the sorts of bets being placed in the current venture market, this article might be a little bit terrifying for you. The business details and funding size are nothing short of staggering. [Link]
Slack, a Leading Unicorn, Raises $200 Million in New Financing by Mike Isaac (NYT)
We love Slack and it’s become a key tool for Bespoke, so we found this anecdote on the company’s fundraising activity and current business quite interesting. [Link]
Amazon, Alibaba and an Indian Illusion by Andy Mukherjee (Bloomberg Gadfly)
A dive into the Indian market that Amazon serves and the absurd degree of regulation and anti-competitive behavior that dominates the Indian retail market. [Link]
Hedge Funds Have a Performance Problem by Nir Kaissar (Bloomberg Gadfly)
A look into recent hedge fund returns which somehow manages to admirably abstain from contextless comparisons of hedge fund profits to the S&P 500. We’re a fan of the rare media take on funds that does not make this frankly horrific rookie error. Correctly, Kaissar does compare risk-adjusted returns of hedge funds to other alternatives like stock indices and bonds. [Link]
Citi: Robo-Advisers Will Never Take the Place of Traditional Investment Managers by Julie Verhage (Bloomberg)
Citi analyst Ronit Ghose argues that robo-advisors (algorithm-driven platforms for low-cost diversified investing) are not going to put a significant dent in the most labor-intensive aspects of asset management. [Link]
A Senator Doesn’t Like It When Companies Lie To The Government by Matt Levine (Bloomberg View)
Should existing regulation (securities law) be used as a method to forward political agendas on other subjects? In this case, Senator Elizabeth Warren of Massachusetts is hoping to punish companies for making different statements to different groups (investors and the government) regarding the proposed fiduciary rule as a way to reduce their opposition to that rule. We broadly agree with his conclusion that this is a slippery slope and probably not the best way to operate government in the general sense. [Link]
Bear Stearns and the Bodyguard of Lies by Roddy Boyd and Teri Buh (Southern Investigative Reporting Foundation)
SIRF does good work as an independent and enthusiastic investigator of all sorts of market miscellany, and while this story is basically old news given how long ago its key events take place, it’s still an instructive piece of insight into what happened during the lead-up to the Global Financial Crisis. [Link]
The North American Free Trade Agreement (NAFTA) by M. Angeles Villarreal and Ian F. Fergusson (Congressional Research Service)
The Congressional Research Service is a nonpartisan body within the Library of Congress that works exclusively for Congress, developing policy and legal analysis at the committee and Member level. They do excellent work on a variety of subjects and this paper on NAFTA is a helpful piece of background given the current “moment” that free trade is enjoying in the spotlight. [Link]
Testing Territorial Limits by Vann R. Newkirk II (The Atlantic)
American territories occupy a unique position within our system of government, and that can create some problematic implications for their citizens and the country at large. [Link]
How to Hack an Election by Jordan Robertson, Michael Riley, and Andrew Willis (Bloomberg Businessweek)
This sweeping narrative investigates the story of a former hacker who claims to have helped throw elections across Latin America while being financed by one of the world’s most powerful political consultants. It has grim implications for the intersection of money, technology, and politics in general as well as the 2016 US political election specifically. [Link]
Another Condo Bust Looms in Miami by Laura Kusisto (WSJ)
As the USD has soared and commodity-driven economies around the world have slowed amidst a price bust, the soaring towers of South Beach and Brickell have run into a ceiling. [Link, paywall]
China’s True Demand For Copper Is Only Half as Much as You Think by Luke Kawa (Bloomberg)
A faintly nerve-wracking analysis of what copper imported to China has actually been used for and why that demand is not likely to be sustainable. [Link]
The Effect of Exchange Rate Shocks on Domestic Prices by Mary Amiti, Olek Itskhoki, and Jozef Konings (NY Fed Liberty Street Economics)
How do changes in the exchange rate translate into domestic prices and how do those effects vary across economies? This excellent blog post endeavors to explain. [Link]
How New York Gets Its Water by Emily S. Rueb (NYT)
A fascinating and digestible look into the colossal logistics of municipal water infrastructure that serves New Yorkers. [Link]
What Happened to Migration in 2014 (2013?)? by Lyman Stone (Medium)
A very cool post that looks at a variety of data sets to assess the recent state of US internal migration. Full of interesting charts and data nerding. [Link]
Team of Rival Scientists Comes Together to Fight Zika by Amy Harmon (NYT)
We love Twitter and in the case of an effort to map the genome of the mosquito species which carries Zika the platform served as an important catalyst, as did numerous other recent technological developments. [Link]
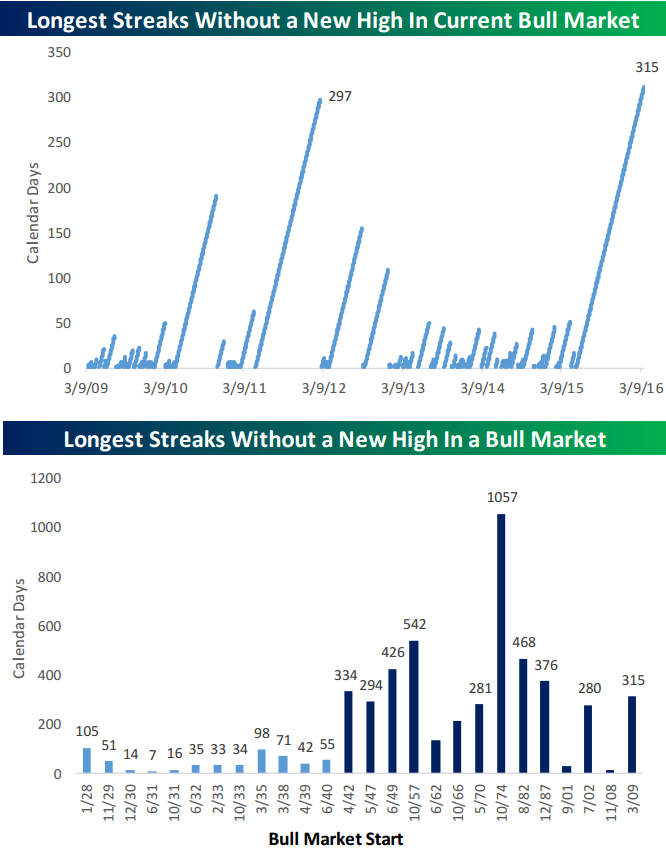
10 Months and Counting Without a New Bull Market High
On Friday, Bespoke published its Q2 2016 quarterly outlook piece. Our outlook pieces (both annually and quarterly) cover the ins and outs of everything going on in financial markets, with invaluable insights on valuations, technicals, sentiment measures, seasonality, and more. The report is in-depth, but it’s presented in a way that’s extremely easy for investors to digest. That’s what Bespoke is best known for: analyzing complicated market data with unique charts and graphics that are quick and easy to interpret.
Click here to learn how you can access our Q2 2016 quarterly outlook piece with a 20% membership discount.
Below are two charts from our just-published Q2 2016 Bespoke Report outlook piece. The first chart below shows the S&P 500’s longest streaks during the current bull market without making a new bull market high. At 315 days and counting, the current streak is now the longest. With over ten months having passed since the last new bull market high last May, is the market in the midst of a transformation to a bear market?
By itself, the long stretch of time without making a new bull market high is not indicative of a bear market. The second chart below shows the longest stretches of time that transpired without making a new high in each prior bull market for the S&P 500. In the pre-WWII period (light blue), the longest stretch of time was just over three months (105 days). Since WWII (dark blue), though, it has been very common to have extended periods where the S&P 500 goes nine months or more without making a new high. This period could easily just be a pause and re-charge for a bull market that raged for six years from 2009 to early 2015.