B.I.G. Tips – Retail Sales Weaker Than Expected
Retail sales for the month of March were released earlier this morning and came in weaker than expected across the board. On a headline basis, retail sales actually fell 0.3% compared to forecasts for a m/m gain of 0.1%. Most of this weakness was due to Autos, and after backing out that category, sales grew 0.2%, but that was still below the consensus expectation of 0.4%. Ex Autos and Gas, sales increased 0.1%, which was also weaker than the 0.3% estimate. While March’s numbers missed the mark, the weakness was somewhat offset by upward revisions to February’s numbers.
One notable aspect of this month’s report was the strength in Building Materials. While overall retail sales have been steadily trending lower on a y/y basis for several years now (blue line), the chart for Building Materials (red line) has been bucking the trend considerably. In fact, through March’s report, the gap between the y/y change between the two series was over nine percentage points. The only time the gap between the two has been wider was back in March and April of 2004.

In a B.I.G. Tips report just sent to Bespoke Premium and Bespoke Institutional members, we further break down the details of today’s report.
See the full B.I.G. Tips report by signing up for a monthly Bespoke Premium membership now. Click this link for a 10% discount ($89/month).
Crude Oil Inventories Rise Much More Than Expected
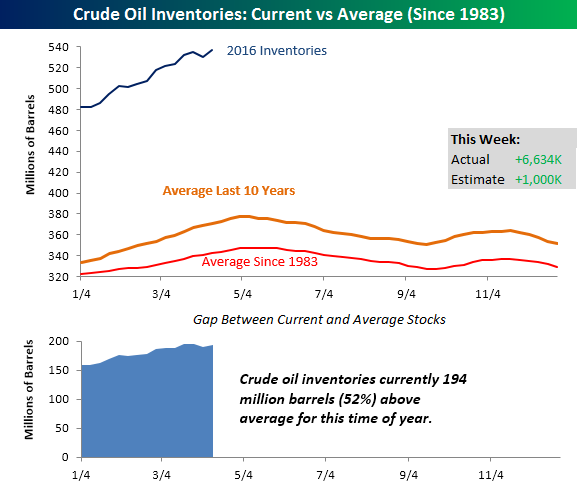
This week’s inventory report from the Department of Energy showed a much larger than expected build in crude oil inventories. While traders were expecting stockpiles to increase by 1 million barrels, the actual increase was nearly seven times that at 6.634 million. With this week’s build, US inventories are now back to multi-decade highs, and are currently 194 million barrels (52%) above their historical average for this time of year. Looking ahead, over the next few weeks we should start to see the seasonal build in inventory levels transition to drawdowns as we enter the summer season.
Start a 14-day no obligation free trial to see Bespoke’s premium market content over the next two weeks.
The Closer 4/12/16 – “The NY Fed Weighs In On GDP Tracking”
Looking for deeper insight on global markets and economics? Tonight in The Closer we compare and contrast a new GDP tracking estimate created by the NY Fed with the existing Atlanta Fed GDPNow. We examine methodology and reliability of both trackers, and the issues with any kind of GDP tracking. We also review this month’s report on the federal government budget deficit and chart the rolling beta of the S&P 500 to various other asset classes over the past 8 years.
The Closer also includes its standard charts, large volume and price movers in the US equity market, and Bespoke’s Market Timing Model. The Closer is one of our most popular reports, and you can sign up for a trial below to see it free for the next two weeks!
[thrive_leads id=’58717′]S&P 500 Energy Sector Closes Above 200-Day Moving Average After 566 Days Below
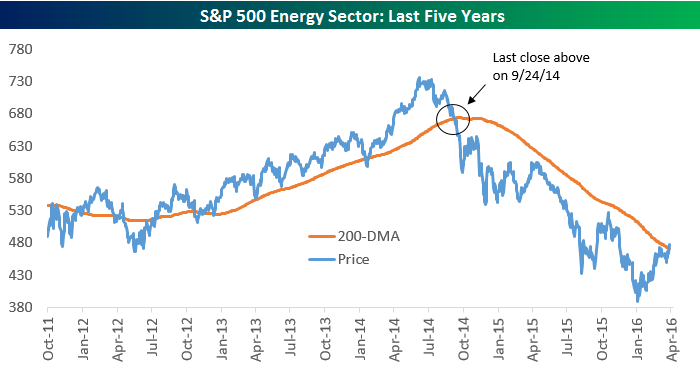
The S&P 500 Energy sector closed above its 200-day moving average after closing below it for the last 566 days going back to September 24th, 2014!
Start a 14-day no obligation free trial to Bespoke’s research to see a note we published earlier today with our outlook on Energy stocks.
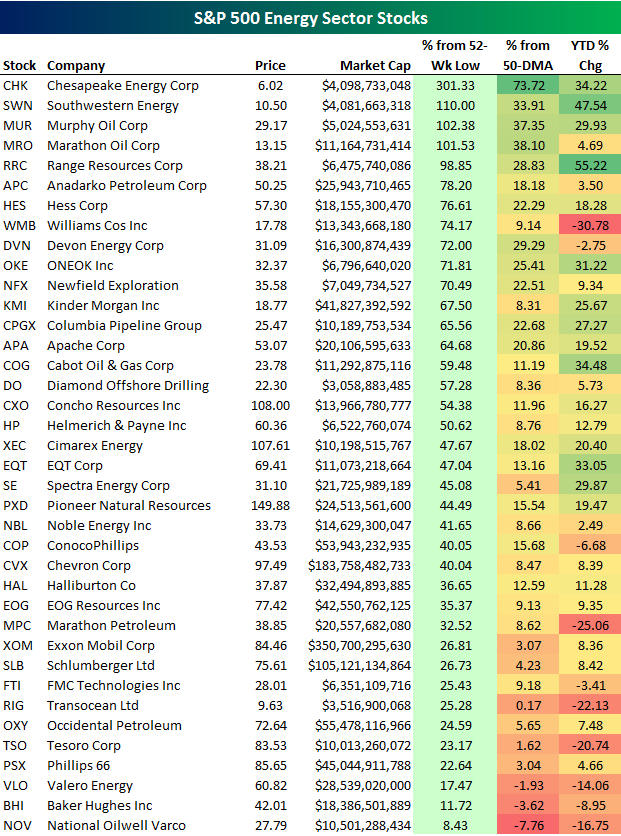
Below is a list of the stocks in the S&P 500 Energy sector. For each name, we show how much is has bounced off of its 52-week low, how far it is from its 50-day moving average, and how much it’s up or down year to date.
As shown, about half of the stocks in the sector are now more than 50% above their 52-week lows, and four are more than 100% above their lows (CHK, SWN, MUR, MRO). Exxon Mobil (XOM) — the largest stock in the sector — is up 26.8% from its 52-week low and up 8.36% YTD. Chevron (CVX) — the second largest stock — is up 40% from its low and up 8.39% YTD.
B.I.G. Tips – Key Trend Shift for Energy Sector
Bespoke Short Interest Report – 4/12/16
Bespoke Stock Scores: 4/12/16
Chart of the Day – Energy Sector Breaks Above 200-DMA
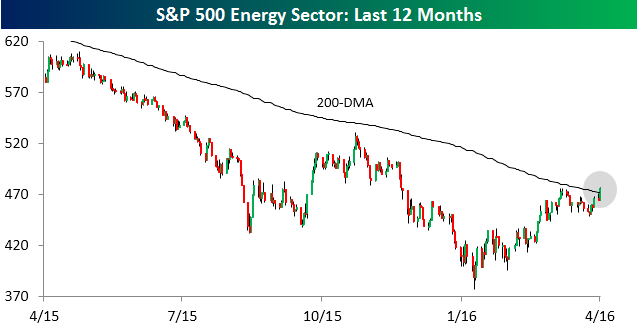 With today’s 3% rally, the S&P 500 Energy sector is poised to close above its 200-DMA for the first time in nearly a year and a half (9/24/14). The current streak of closes below the 200-DMA is the longest for the sector dating back to at least 1990. In today’s Chart of the Day, we took a look at prior periods where the Energy sector closed below its 200-DMA for an extended period of time.
To read our Chart of the Day, enter your info below and start a free Bespoke research trial. During your trial, you’ll also receive access to our model stock portfolios, daily market alerts, and weekly Bespoke Report newsletter.
[thrive_leads id=’59052′]
ETF Trends: International – 4/12/16
NFIB Small Business Optimism Falls For Third Month Straight
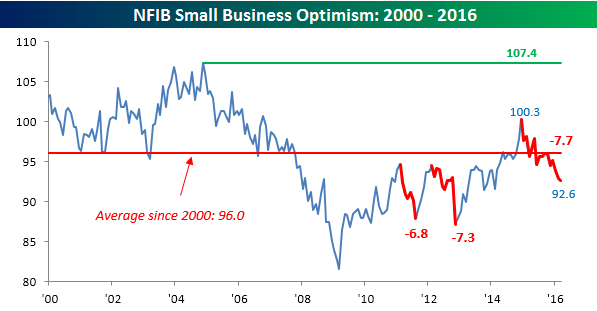
A “chartist” looking at the data historically might conclude that the Index has clearly hit a top and is flashing a recession signal.
Ouch. The above line from this month’s NFIB monthly economic trends report doesn’t pull any punches regarding the state of sentiment among small businesses in the US. As the chart below illustrates, the NFIB’s overall index of small business optimism has declined for three straight months, extending what has been its largest peak to trough decline of the current economic expansion, and taking the index down to its lowest level since February 2014. Not only has the headline index declined for three straight months, but it has also missed expectations in each of those months.
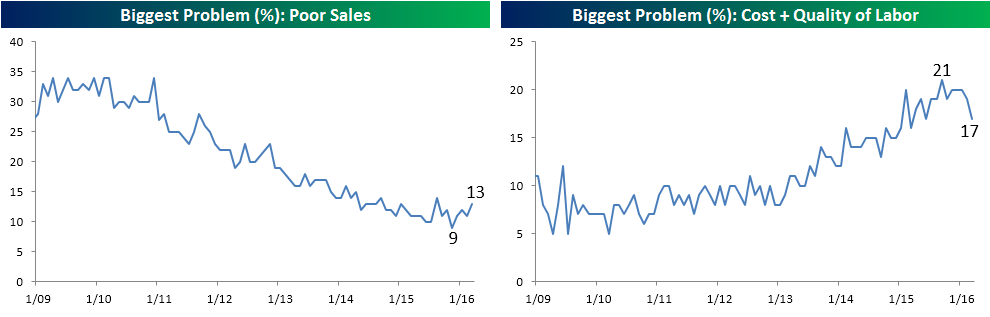
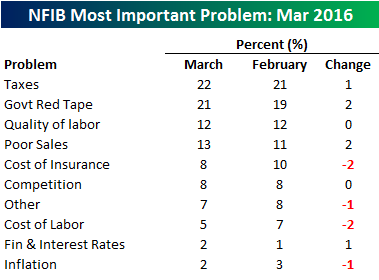 The table to the right breaks down which issues small businesses consider to be their number one problem. Topping the list this month (like they do every other month) are the issues of Taxes and Government Regulation/Red Tape. Both issues saw the percentage citing them increase this month, taking the combined total up to 43%. Behind these two issues, Poor Sales saw the percentage citing it as the number one problem increase by two percentage points up to 13%. Back in November, this issue bottomed out at 9% but has seen a pretty steady increase over the last four months. As businesses have become increasingly worried about sales, concerns over the cost and/or quality of labor have declined by a proportionate amount.
Start a trial now to get Bespoke’s premium research free for the next two weeks.