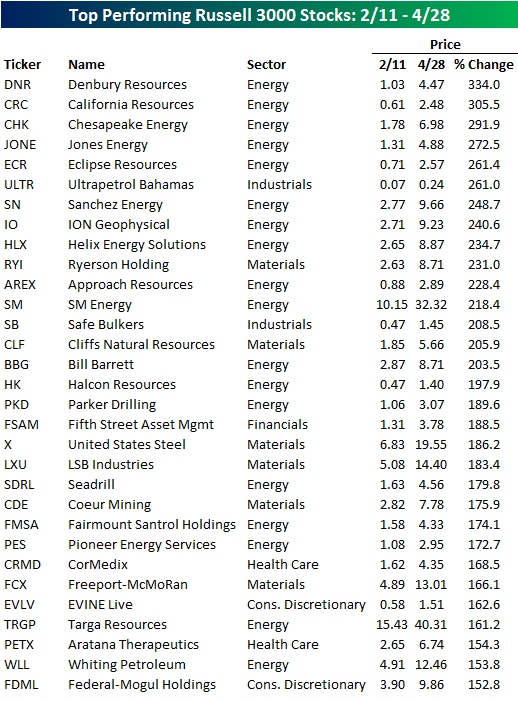
Top Performing Russell 3000 Stocks Since 2/11
In an earlier post, we highlighted the fact that small-cap stocks have been leading the market higher in the rally off the 2/11 lows. Looking at the stocks that have done the best since 2/11, it would also appear as though not only have stocks with low market caps done well, but so have ones with low prices too. The table below lists the 31 stocks in the Russell 3000 that have risen more than 150% since the market’s closing low 11 weeks ago today. As shown, the average closing share price of these stocks on 2/11 was a measly $2.85. Additionally, only two stocks were trading above $10 per share while only another two had share prices with a five-handle. What really stands out about the table, though, is the preponderance of stocks from the Energy sector. Over half of the stocks listed are from the sector including each of the top five spots.
the Bespoke 50 — 4/28/16
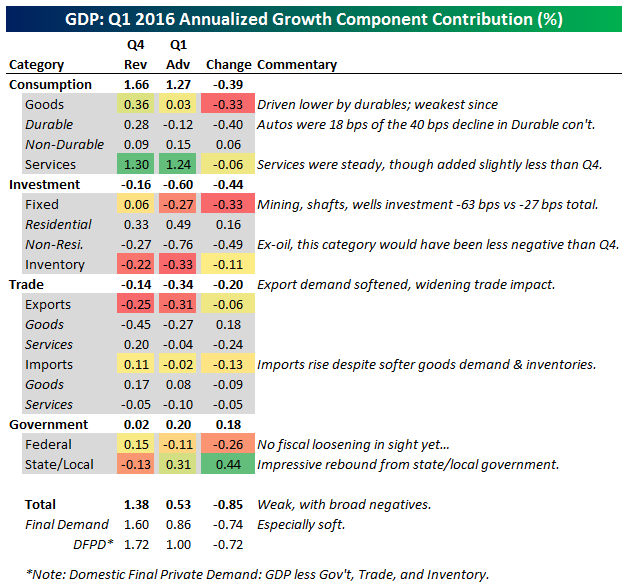
Q1 GDP Misses Slightly On Broad Deceleration Across Categories
The Advance estimate of Q1 GDP from the Bureau of Economic Analysis released this morning showed a notable deceleration in growth across categories. Estimates were calling for growth in the neighborhood of +0.6% QoQ, at an annual rate. The actual unrounded number was +0.54%, so these estimates weren’t half bad! However, the result was still disappointing as weaker spending on cars helped push down the contribution of durable goods to GDP, investment in shaft/well structures (a proxy for oil & gas fixed investment) shaved over 60 bps from headline GDP, and the trade deficit widened. Below we summarize the release in our table which shows the contribution to total GDP by category for Q4 and Q1 as well as the change between last quarter and this quarter.
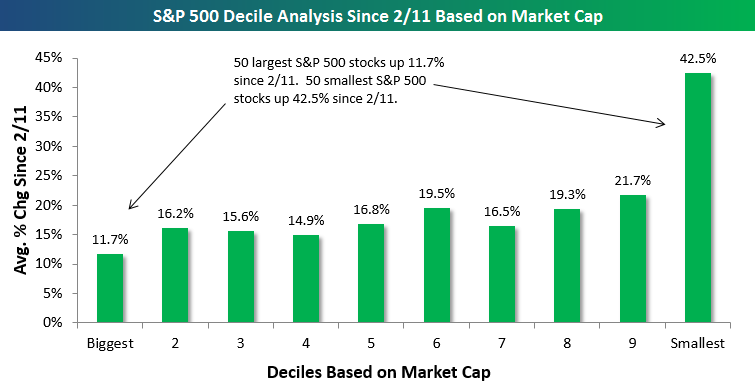
The Smaller the Better in 2016
A common theme you’ve probably heard recently is that breadth has been strong during the rally off the market’s 2016 lows on 2/11. Small and mid-cap stocks have contributed just as much as large-cap names, which is a healthy sign. Even within the S&P 500 — which is an index of all large-cap stocks — smaller names in the index have led. You can see this trend in the chart below, which breaks the S&P 500 into deciles (10 groups of 50 stocks each) based on a stock’s market cap on 2/11. Decile 1 on the left contains the 50 largest stocks in the index — basically the mega-caps. Decile 10 on the right contains the 50 smallest stocks in the index. For each decile, we show how the average stock has performed since the 2/11 low. As you can see, the 50 stocks in the biggest decile are up an average of just 11.7% during the rally. The 50 smallest stocks in the S&P? They’re up an average of 42.5%! That’s some serious outperformance.
Other stock characteristics like dividend yield, valuations, analyst sentiment, and short interest have also impacted performance. Start a 14-day no obligation free trial to our paid research to see more of our decile analysis.
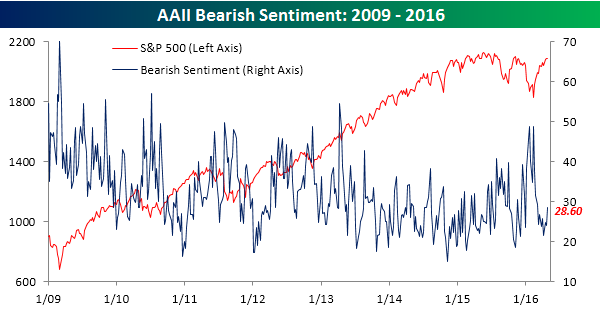
Investors Still Having None of this Rally
It looks as though some of the big disappointing earnings reports are starting to weigh on investor sentiment. According to the latest weekly sentiment survey from the American Association of Individual Investors (AAII), bullish sentiment dropped down to 27.37% this week from last week’s reading of 33.41%. This now makes it 26 straight weeks where bullish sentiment has been below 40%, and 60 out of the last 61 weeks. Investors still want nothing to do with the most recent equity market rally.
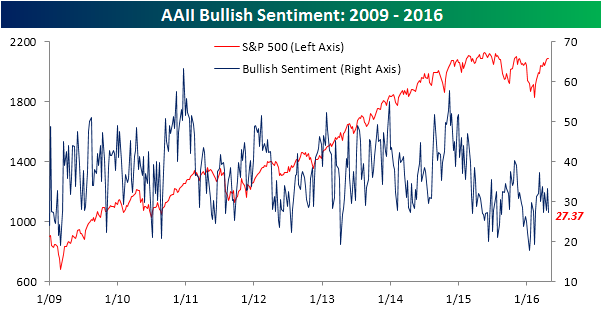
With this week’s decline in bullish sentiment, more investors are now bearish than bullish. In this week’s survey, bearish sentiment rose to 28.66% from 23.92% last week. Bearish sentiment is still nowhere near levels it was earlier this year, but this is the first time since late February where bears have managed to outnumber the bulls.
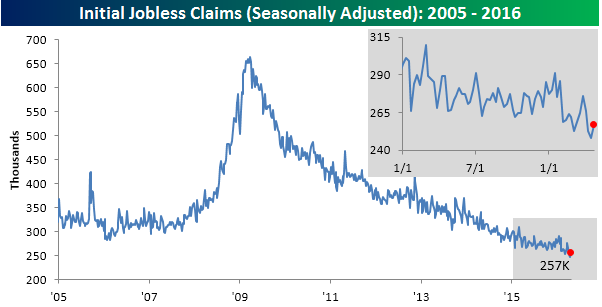
Jobless Claims Rise, But Four-Week Moving Average Drops to Multi-Decade Low
Jobless claims rose less than expected this week, coming in at a level of 257K versus consensus estimates of 259K. It has now been 60 weeks since we last saw weekly claims come in above 300K.
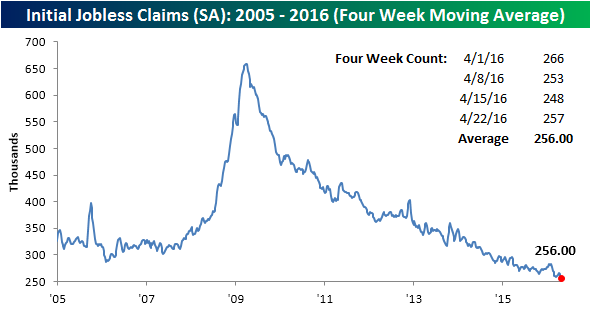
Even though the weekly claims reading rose by 9K, the four-week moving average actually fell to another multi-decade low of 256K. That’s the lowest level since December 1973!
Finally, on a non-seasonally adjusted (NSA) basis, jobless claims increased by 2.8K. That’s the lowest reading for the current week of the year since 2000 and more than 100K below the average for the current week of the year since 2000.
Start a 14-day no obligation free trial to see Bespoke’s premium market research.
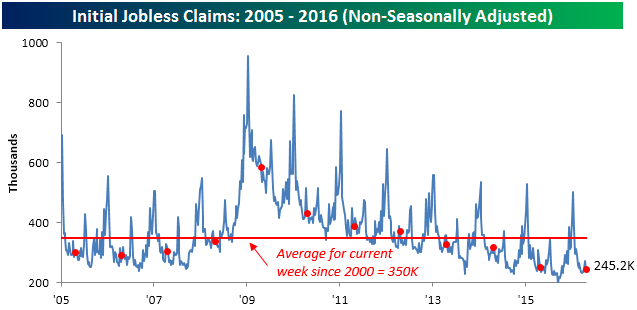
Chart of the Day – Advance Reads on Q1 GDP and the Calendar
The advance read on Q1 GDP will be released at 8:30 Eastern time, and with all the distortions to economic data that we have recently seen due to the early Easter, we wondered what impact a March Easter had on Q1 GDP readings. In today’s Chart of the Day, we looked at how Q1 GDP has come in on an actual basis and relative to expectations based on whether Easter falls in March or April.
You can access today’s Chart of the Day by starting a 14-day no-obligation free trial to our paid research platform.
ETF Trends: Fixed Income, Currencies, and Commodities – 4/27/16
B.I.G. Tips — Decile Analysis of the Rally
Chart of the Day – 4/27/16: Apple (AAPL) is Cheaper Than…
Apple (AAPL) is currently trading down more than 27% from its 52-week high of $134.54 made nearly a year ago. Ever since AAPL has fallen on hard times, and even before that, the stock’s relatively low earnings multiple has been cited as a key reason to own the stock. In today’s Chart of the Day, we have no interest in citing AAPL’s multiple as a bullish (or bearish) factor impacting the stock. What we do want to do, though, is show where AAPL’s multiple currently stands relative to other stocks in the S&P 500. We’ll let you make up your own mind as to whether you think its ranking is reason enough to own the stock or not.
You can access today’s Chart of the Day by starting a 14-day no-obligation free trial to our paid research platform.