B.I.G. Tips – May Dividend Report
B.I.G. Tips – Years Like 2016 May Edition
Bespoke Stock Scores: 5/3/16
Chart of the Day: April Auto Sales Tracking A Rebound
Analysts are expecting a big rebound of about 1mm (seasonally adjusted annual rate) in auto sales this month. Below we chart our tracking of the sales rate for the month of March as it evolved throughout the day last month.
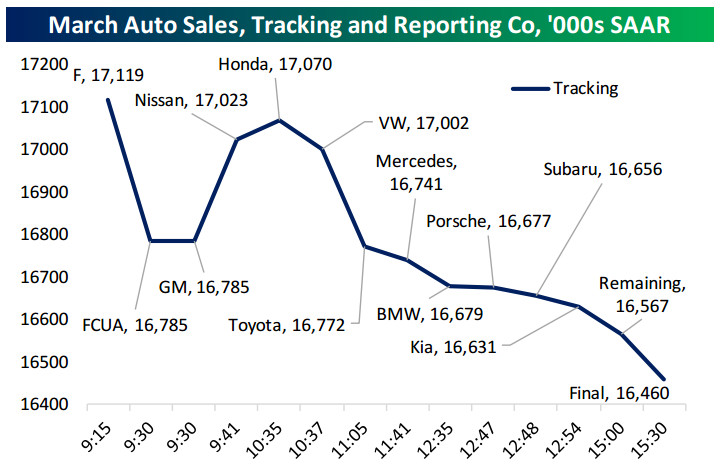
In today’s chart, we update that chart to reflect April sales figures. We also show sales volumes and growth by manufacturer for companies that have reported so far.
Continue reading today’s Chart of the Day on Apple (AAPL) by starting a 14-day no-obligation free trial to our paid research platform.
Fairway (FWM) Markets Reaches Its Expiration Date
Shares of Fairway (FWM) are trading down over 50% today on news that the company was going to file a prepackaged Chapter 11 bankruptcy. Looking at the chart now, it’s hard to imagine that just over three years ago this was one of the hottest IPOs around. For a little backstory on the company, Fairway (FWM) started out as a single store in the Upper West Side of New York decades ago. In the late 1990s, they expanded from a single store and gradually opened additional ones in the New York City area. During that expansion, Fairway became one of the trendiest food stores in New York, so when the company IPOd in early 2013, traders who had experienced the store themselves or heard about it through their spouses or friends couldn’t get enough of it. Within three months of its IPO, Fairway was more than a double from its IPO price of $13.
The bloom on Fairway quickly wilted, though. From its high of $28.87 on 7/11/13, it began its long and painful descent from there to here. At today’s prices, it is down 99.6% from its all-time high and 99% from its IPO price of $13. During that time, the market cap has dropped from well north of half a billion to $4 million today.

One of the main tenets of legendary mutual fund manager Peter Lynch’s investment philosophy is that investors should only buy what they know. In the case of Fairway, they saw a store that they either liked through first-hand experience or the rave reviews of their peers, so they went out and bought it. What often gets lost in the discussion of Peter Lynch’s style, however, is that these first-hand experiences should only be used as a starting point. Investors should follow up these experiences with research on potential investments through an analysis of the company’s sales, growth, and debt levels. If traders that were so quick to buy Fairway had taken the time to look into the company’s financials, maybe they would have reached a different conclusion on the stock.
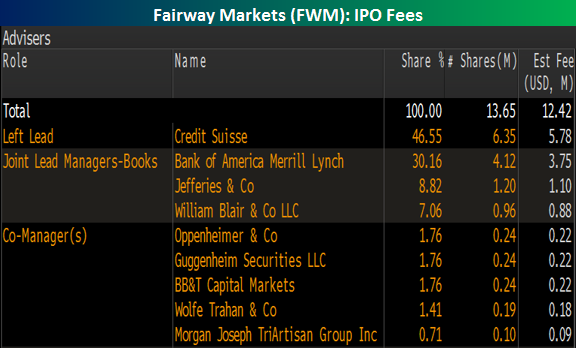
Looking at the chart above, it’s hard to imagine how anyone could have made money on Fairway Markets (FWM) since the company has gone public. One group that made a decent amount, though, was the syndicate of banks that took the company public. The image below is a Bloomberg snapshot of the estimated fees for the underwriters that were generated by the Fairway IPO. While $12.45 million is a pittance by the standards of many Wall Street deals, it is nearly triple the current market cap of Fairway.
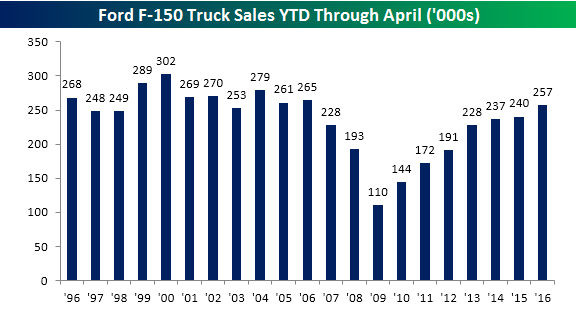
Strong April for Ford Truck Sales
We like to track sales of pickup trucks as they are often a sign of strength or weakness in the small business and construction sectors. These types of businesses are the most common users of these vehicles, so sales of trucks provide a good barometer for how these industries are doing. In April, Ford truck sales continued to motor along with total sales of 70,774. Without taking into account changes in the calendar from year to year, this April’s total sales of Ford trucks was the strongest since 2005. While this is a decade high, in the ten year period from 1996 through 2005, total sales for April were routinely above current levels.
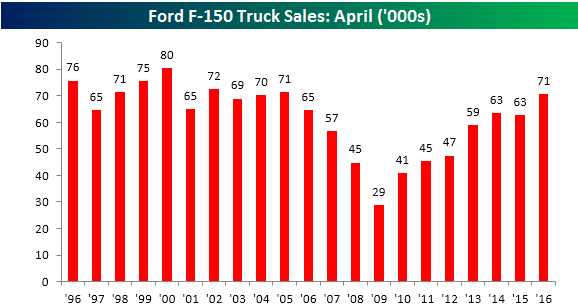
On a year to date basis, total sales of Ford trucks for 2016 are now up to 256,895. Since the lows in 2009, YTD sales through April have increased every year with 2016’s total sales rising 6.97% compared to 2015’s first four months. This year’s total is also the highest since 2006, but like the April number it is a level that was considered routine in the late 1990s and early 2000s.
Start a 14-day no obligation free trial to our premium research platform to see more of our market analysis.
Dynamic Upgrades/Downgrades: 5/3/16
ETF Trends: US Sectors & Groups – 5/2/16
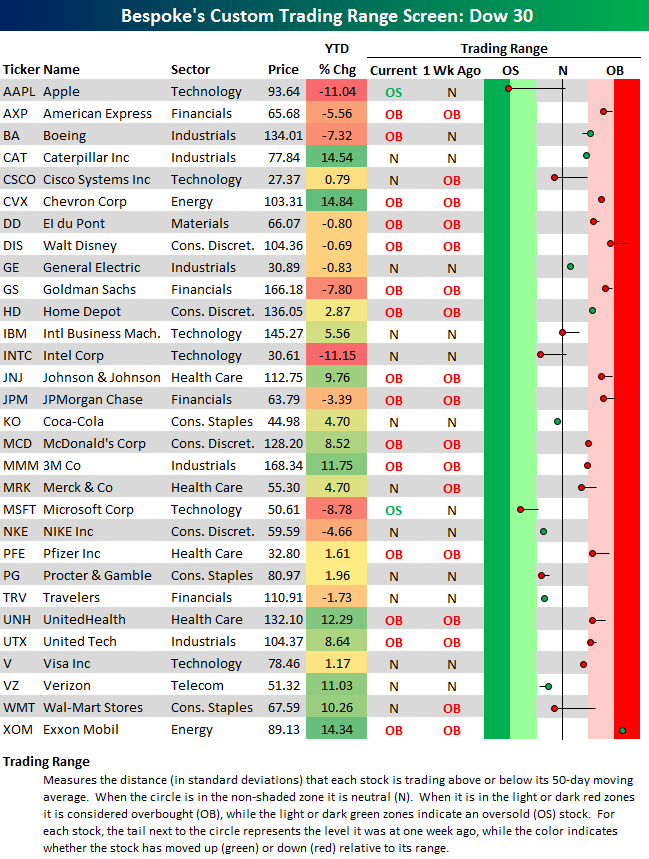
Dow 30 Trading Range Screen
Below is an updated look at our Dow 30 trading range screen. For each stock, the dot represents where it’s currently trading within its range, while the tail end represents where it was trading one week ago. The black vertical “N” line represents each stock’s 50-day moving average, and moves into the red or green zones are considered overbought or oversold.
Exactly half of the stocks in the Dow are trading in overbought territory, while just two are oversold — Apple (AAPL) and Microsoft (MSFT). Apple is the most oversold stock in the index at more than two standard deviations below its 50-day moving average. Last week at this time, Apple was above its 50-day, so it’s been a rough few days for the largest company in the world.
Through today, Apple (AAPL) has been the second worst performing stock in the Dow year-to-date with a decline of 11.04%. Only Intel (INTC) has done worse in 2016 with a decline of 11.15%. Other notable losers this year include Boeing (BA), Goldman Sachs (GS), Nike (NKE), and American Express (AXP).
On the positive side, you may be surprised to see Chevron (CVX) at the top of the list of best performers in the Dow YTD. The stock is now up 14.84% in 2016, which is 9 basis points better than the second best performer in the index — 3M (MMM). Caterpillar (CAT) — another stock that has been beaten down over the last few years — ranks third with a year-to-date gain of 14.54%.
Start a 14-day no obligation free trial to our premium research platform to see more of our market analysis.