Five Week High For Jobless Claims
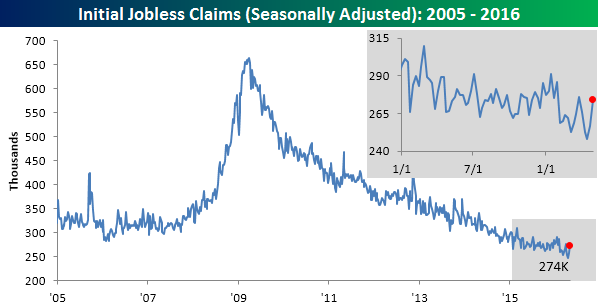
After four straight weeks of better than expected readings, jobless claims edged up to a five-week high this week. While economists were forecasting first-time claims to come in at a level of 260K, the actual reading came in 14K higher at 274K, which was also the highest weekly reading since the last week of March. Even with the higher than expected reading, claims have now been below 300K for a ridiculously long stretch of 61 straight weeks.
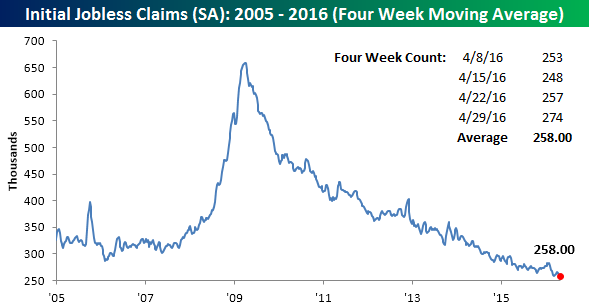
With this week’s increase, the four-week moving average ticked higher rising from 256K up to 258K. While this week’s increase was modest, unless we get a big drop in the weekly reading next week (below 253K), the four-week moving average should see a larger increase.
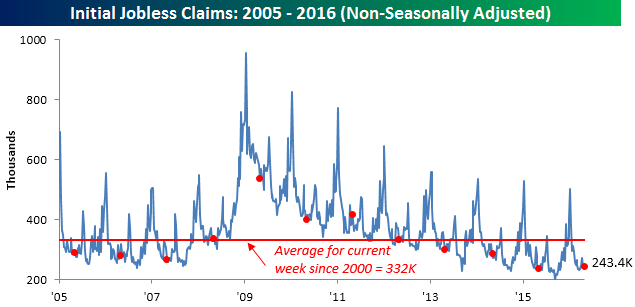
On a non-seasonally adjusted (NSA) basis, claims fell by slightly less than 2K to 243.4K. This is 89K below the average for the current week of the year dating back to 2000, but actually higher than the comparable week from last year.
ETF Trends: Fixed Income, Currencies, and Commodities – 5/4/16
A Case for 3-Day Weekends!
Start a 14-day no obligation free trial to our premium research platform to see more of our market analysis.
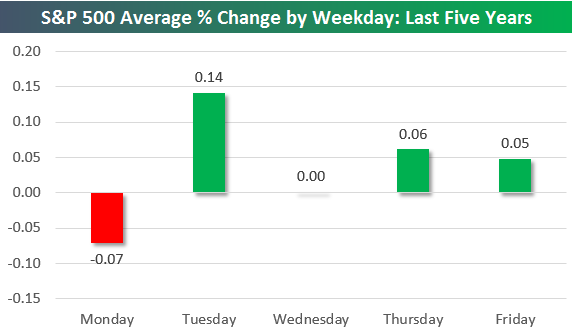
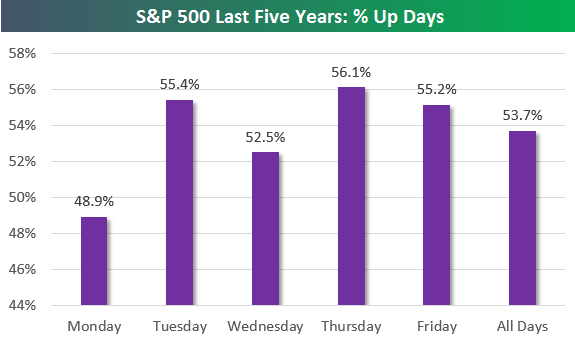
The S&P 500 has been open on 1,259 trading days over the last five years, and the index has averaged a change of +0.038% on these days. Below is an updated look at the S&P 500’s average change by weekday over this time period. As shown, four days of the week have seen the market average gains, while one day of the week has averaged a decline — Monday. Over the last five years, the S&P has averaged a decline of 0.07% on Mondays with positive returns just 48.9% of the time. After Mondays, though, things turn higher. Tuesday has been the best day of the trading week with a gain of 0.14%. Thursday has been the second best at +0.06%, followed by Friday at +0.05%. Wednesdays have basically been a wash.
The S&P 500 is up 52% over the last five years, which we chart below. But we’ve also included the S&P’s performance if you take out Mondays. That means you buy at the close on Monday and sell at the close on Friday. If you remove Mondays from the mix, you’d be up 82.3% over the last five years. Be sure to use this analysis the next time you ask for a 3-day weekend!
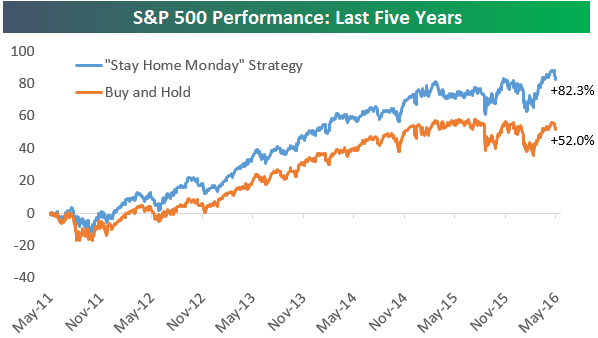
Chart of the Day: Earnings Revisions Spread Turns Positive
In our regular update of the various indicators we track, one notable standout today was the spread between positive and negative analyst earnings revisions for S&P 1500 stocks. In this morning’s update, we calculated that over the last four weeks, analysts had raised EPS forecasts for 612 companies in the S&P 1500 and lowered EPS forecasts for 605. This works out to a net of +7. That may not sound like much, but it’s actually the first positive earnings revisions reading we’ve seen in close to two years!
In today’s Chart of the Day, we highlight prior periods where the revisions spread turned positive after extended periods of a negative spread including how the overall equity market performed going forward.
Continue reading today’s Chart of the Day by starting a 14-day no-obligation free trial to our paid research platform.
ISM Non Manufacturing Report Rebounds in April
After a weaker than expected reading for the manufacturing sector earlier in the week, the ISM Non-Manufacturing report for the month of April rebounded and surpassed economist expectations. While consensus estimates called for the headline index to remain unchanged at 54.5, the actual reading came in quite a bit higher at 55.7, which was the best reading of the year. On a combined basis, and accounting for each sector’s overall share of the US economy, the ISM for April increased from 54.2 up to 55.1. That’s also the highest reading of the year.

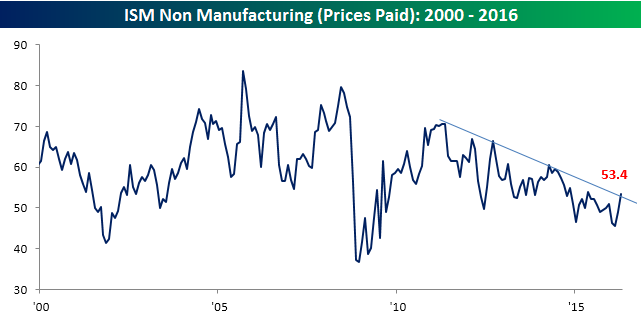
The table below summarizes the m/m and y/y change for each of the ISM Non-Manufacturing report’s ten components. Breadth in this month’s report was mixed with a positive skew as five components showed m/m increases, four declined, and one was unchanged. The biggest increases on the month were Prices and New Orders while Export Orders saw the largest decline. Like the m/m figures, the y/y changes were also mixed with six increases and four declines. The biggest y/y increases were in Export Orders and Prices, while Employment and Backlog Orders saw the largest declines.
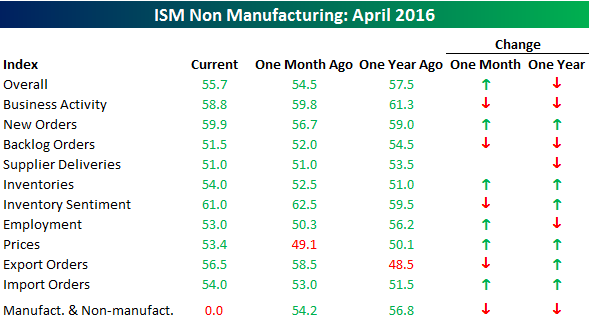
Of all ten components, the chart of Prices Paid is the most interesting. While it has been in a steady downtrend for several years now, this month’s increase (largest since September 2012) is taking the index right up to its recent downtrend line. Will this be just another failed test or the beginning of a breakout? Tune in next month.
Bespoke’s Consumer Pulse- May 2016
You do not currently have access to this report. Sign up for a 30-day free trial to our Pulse add-on service here.
Dynamic Upgrades/Downgrades: 5/4/16
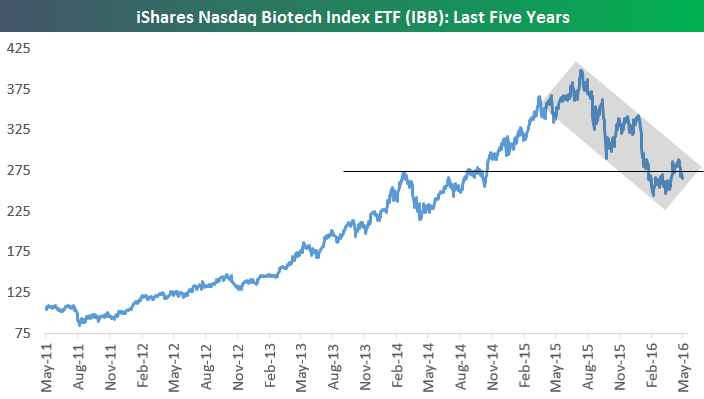
Biotech Remains Stuck in Downtrend
Start a 14-day no obligation free trial to our premium research platform to see more of our market analysis.
The Biotech group managed to rally 18% off its February lows, but it’s worth pointing out that over the last couple of weeks, it has begun to roll over again. Below is a chart of the iShares Nasdaq Biotech ETF (IBB) over the last five years. After surging for multiple years from late 2011 through mid-2015, the group has been a serial underperformer and is down 33% since peaking last July.
Unlike the Energy sector, which has managed to break above the top of its downtrend channel, Biotech remains stuck in a nasty downtrend.