Pulse Points – Chipotle (CMG), Zillow (Z), and Southwest (LUV)
Today we have published a new Pulse Points report with key survey data on three companies — Chipotle (CMG), Zillow (Z), and Southwest Air (LUV). See the report by signing up for a 30-day free Consumer Pulse add-on trial today.
Weak Jobs Print, But More Going On Under The Hood
Start a 14-day no obligation free trial to our premium research platform to see more of our market analysis.
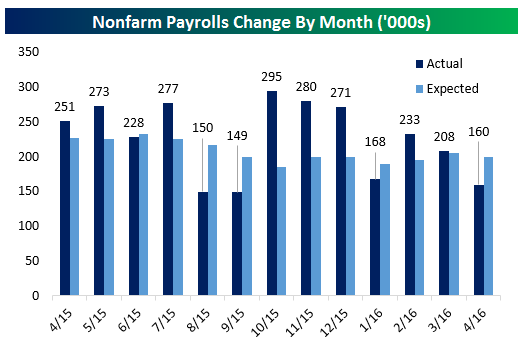
Today’s nonfarm payrolls print missed, with businesses reporting the creation of 160,000 jobs for the month of April. That was versus expectations of 200,000 and 215,000 last month. The pace of jobs gains lately hasn’t been fantastic, but given the variation we see from one month to the next in the headline jobs print, the 160,000 reading is by no means terrible.
Wage growth came in at a solid +0.3% MoM pace for all private employees. That takes both the all private and production/supervisory only worker wage prints to 2.5% YoY. While that’s pretty modest in nominal terms, keep in mind inflation is well below 2%, so in real terms incomes are growing respectably. Hours worked was also stable, so as payrolls continue to grow and wages also rise, total worker income is up 4.7% YoY, right in the middle of the post-recession range. That’s nothing to complain about!

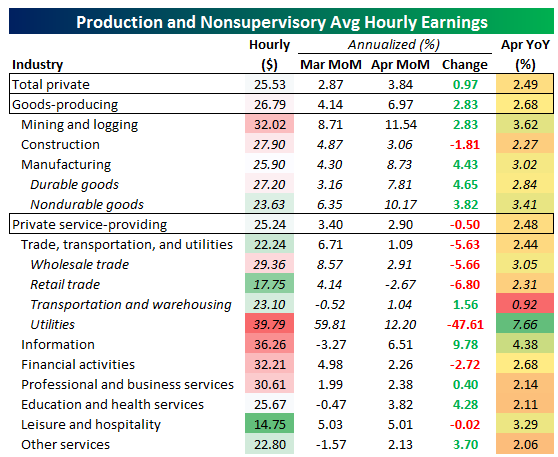
In the table below, we break down average hourly earnings by industry. As shown, most of the weakness in wages this month was from trade/transportation/utilities as Retail and Wholesale trade pay decelerated MoM. The Utilities sector looks terrible, but this very small segment has extremely volatile pay stats that should be taken with a grain of salt. Manufacturing wages were strong, Construction was mixed, and technology (Information) was positive. Leisure and Hospitality saw a second month in a row of 5% annualized wage gains.
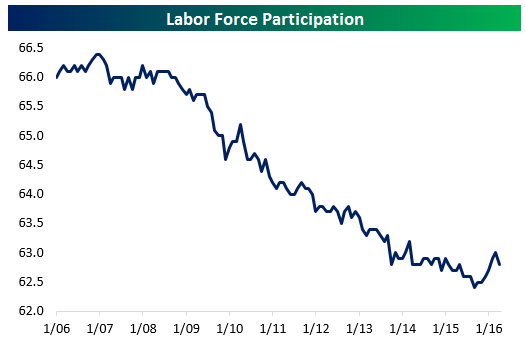
Finally, one dynamic that had been significant in the last few months was the rapid uptick in the labor force participation rate. After 4.484 million workers entered the labor force by moving from “Not In Labor Force” to “Employed” last month, only 4.055 million did this month. The result was lower labor force participation as 4.526 million workers moved from the ranks of the employed to out of the labor force entirely; that’s a proxy for retirements, and is much less sensitive to general labor conditions.
Bespoke’s Sector Snapshot — 5/5/16
We’ve just released our weekly Sector Snapshot report (see a sample here) for Bespoke Premium and Bespoke Institutional members. Please log-in here to view the report if you’re already a member. If you’re not yet a subscriber and would like to see the report, please start a 14-day trial to Bespoke Premium now.
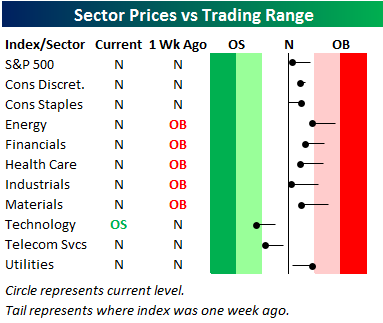
Below is our trading range screen for the ten S&P 500 sectors, which is always included in the weekly Sector Snapshot. The screen allows you to quickly see which sectors have upside or downside momentum, and which sectors may be too extended to the upside or downside. For each sector, the dot shows where it is currently trading within its range, while the tail end shows where it was trading one week ago. The black vertical “N” line represents each sector’s 50-day moving average, and moves into the red or green zone are considered overbought or oversold. The darker the shading, the more extreme the reading.
As shown, last week at this time there were five sectors in overbought territory and zero sectors in oversold territory. As of the close today, there are no longer any sectors in overbought territory and one sector — Technology — is oversold. We’ve clearly seen a slow drift lower for equities over the last couple weeks. As of now the trend can still be categorized as “mean reversion,” but if the S&P can’t hold its 50-day in the coming days, it will be a different story.
To see our full Sector Snapshot with additional commentary plus six pages of charts that include analysis of valuations, breadth, technicals, and relative strength, start a 14-day free trial to our Bespoke Premium package now. Here’s a breakdown of the products you’ll receive.
ETF Trends: US Indices & Styles – 5/5/16
Top Earnings Season Triple Plays — 5/5/16
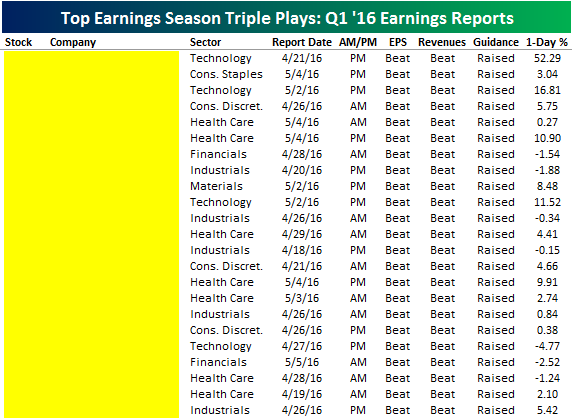 Nearly 2,000 companies have now reported first quarter earnings since the current reporting period began on April 11th. Here at Bespoke, our job is to identify winners and losers, and one of the ways we try to find earnings-season winners is through our list of “triple plays.”
Long-term Bespoke subscribers know how much we like triple plays, but for those that haven’t heard of the term, we came up with it back in the mid-2000s for companies that beat analyst earnings estimates, beat analyst revenue estimates and also raise guidance. Investopedia.com is one of the best online resources for financial markets education, and they’ve actually given us credit for coining the “triple play” term on their website. We consider triple play stocks to be the cream of the crop of earnings season, and we are constantly finding new long-term buy opportunities from this basket of names each quarter.
So far this earnings season, companies raising guidance actually outnumber companies lowering guidance. That’s a rarity these days, and with a large number of companies raising guidance, it provides us with a big list of triple plays as well. So far this season, we’ve gotten 80 earnings triple plays. That’s already 21 triple plays more than we got for the entirety of last earnings season!
Throughout earnings season, Bespoke sends Premium and Institutional members its “Earnings Triple Plays Report.” The report keeps a running tally of recent triple plays, and it also provides a list of “Top Triple Plays.” We’ve just published our most recent Earnings Triple Plays Report, featuring a list of the 80 stocks that have registered triple plays so far this earnings season plus the 23 that we’ve identified as having the most attractive chart patterns. Learn how to see the stocks below.
See our Top Earnings Season Triple Plays by signing up for a monthly Bespoke Premium membership now. Click this link for a 14-day free trial.
the Bespoke 50 — 5/5/16
Chart of the Day: Are Companies Finally Getting Optimistic?
B.I.G. Tips – April Employment Report Preview
Dynamic Upgrades/Downgrades: 5/5/16
Investors Exercising Caution
As the market’s rally has lost steam in the past two weeks, bulls are rushing for the exits. After a six-point decline in bullish sentiment last week, this week’s sentiment survey from AAII showed another five point decline, falling from 27.37% down to 22.33%. Believe it or not, this week’s bullish reading is the lowest since 2/11 – the day of the low for the year when the S&P 500 was 11% lower than it is now! This is now the 27th straight week that bullish sentiment has been below 40% and the 61st week in the last 62.
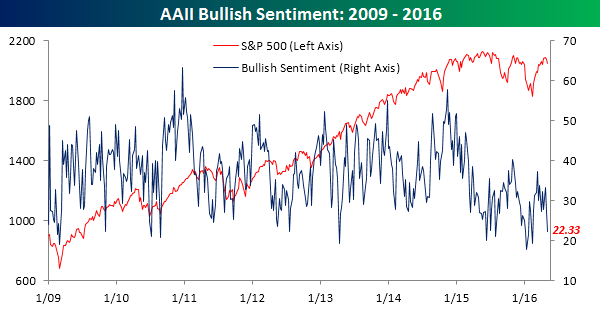
While bullish sentiment has been on the decline, bearish sentiment is back up above 30% to its highest level since February. The S&P 500’s failure to take out its recent highs sure isn’t sitting well in the minds of investors.
