S&P 500 Sector Performance Since the 5/21/15 All-Time High
We’re quickly approaching the one-year anniversary of the S&P 500’s all-time closing high made last May 21st. Below is a look at the performance of the S&P 500 and its ten sectors since that day. As shown, the S&P 500 as a whole is currently 2.4% below its all-time closing high. Since 5/21, four sectors are positive, while six are down. Utilities is up the most with a gain of 10.56%, followed by Consumer Staples at +8.79% and Telecom at 5.69%. All three of these sectors are defensive in nature, which speaks to the type of market we’ve been in over the last 11.5 months. The only other sector in the green since 5/21 is Consumer Discretionary, but nearly all of that gain is due to Amazon.com (AMZN) and Netflix (NFLX). On an equal-weighted basis, the Consumer Discretionary sector would be down as well.
The Energy sector is the main reason why the S&P 500 is still below its 5/21/15 all-time high. Energy is still down 16.56% since then even though it has rallied back 25% from its lows. Materials is down the second-most at -9.3%, followed by Health Care at -6.24% and Financials at -5.91%. The Technology sector is down 2.99%, which is just a bit more than the S&P 500 as a whole.
Over the next two weeks we’ll be doing a few more posts looking at asset class performance since the S&P’s last all-time high, so be on the lookout if you’re interested!
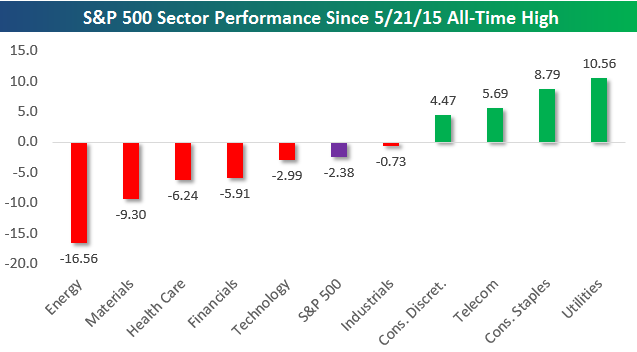
Chart of the Day: Dividend Cuts Hit a Seven-Year High
When it comes to corporate actions in times of financial duress, one of the hardest decisions for a company to make is cutting its dividend. In companies known for paying dividends, the dividend is considered sacrosanct, so the last thing the company wants to do is lose credibility with investors by cutting it. In spite of that, when times are tough companies often have no other choice, and as the last couple of years have shown, it has become increasingly common for companies to cut their payouts.
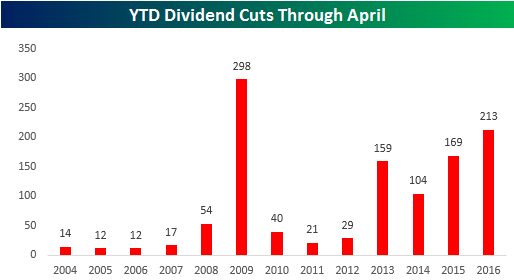 Based on data from the Standard and Poors monthly dividend report, through the first four months of the year, 213 US companies have announced dividend cuts (upper chart right), which is the most cuts through April since the depths of the Financial Crisis in 2009, when 298 companies cut their payouts.
In today’s Chart of the Day, we highlight prior periods where the revisions spread turned positive after extended periods of a negative spread including how the overall equity market performed going forward.
Continue reading today’s Chart of the Day by starting a 14-day no-obligation free trial to our paid research platform.
Bespoke Stock Scores: 5/10/16
ETF Trends: International – 5/10/16
Bespoke Macro Strategist George Pearkes On ‘What Did You Miss?’
Please click the picture below to see Bespoke’s Macro Strategist George Pearkes discuss the recent rise in labor bargaining power on Bloomberg’s ‘What Did You Miss’ yesterday.

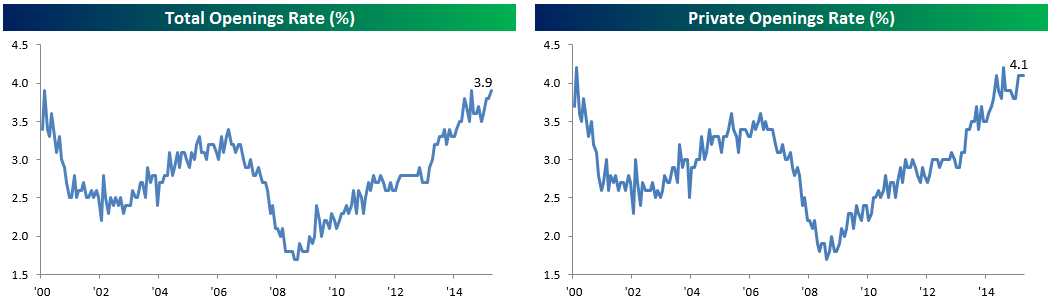
Job Openings Near An All-Time High
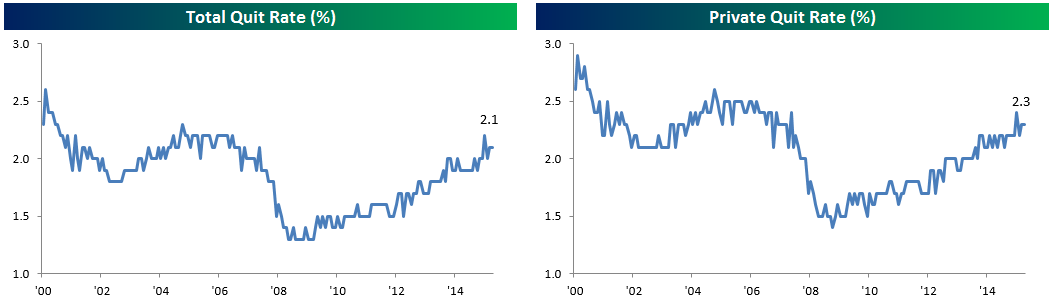
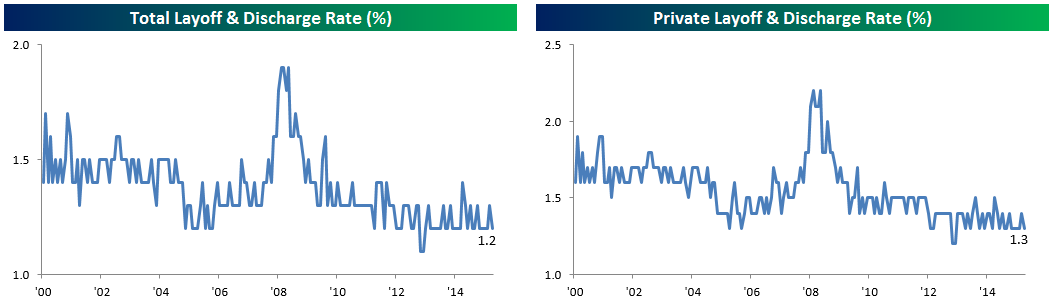
It was a solid report from the Job Openings and Labor Turnover Survey (JOLTS) this month as openings jumped to 5.757 million versus 5.400 million expected. That’s below the all-time high for gross job openings set last year but the trend higher in openings after some moderation in the second half of 2015 suggests labor demand continues to climb. This is consistent with anecdotal evidence in the Fed’s Beige Book, ISM surveys (especially non-manufacturing, where labor has been listed as both in short supply and up in price for the last 9 months), NFIB survey data out this morning, and the Employment Situation Report for April. The total Separations rate was down in March, not necessarily a good thing, but that was more about a decline in layoffs than a lower quit rate.
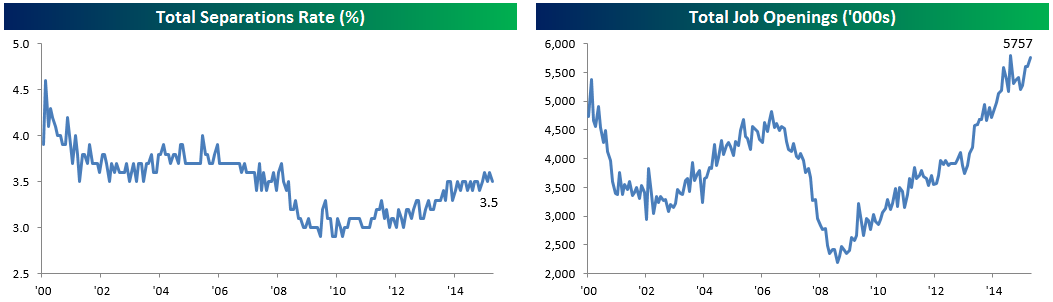
On a rounded rate basis, openings are back to all-time highs, though it’s worth noting that the private openings rate is somewhat weaker on a relative basis, though still right at the top of its range.
As mentioned above, the quits rate remained low with both total quits and private-only quits rates moving sideways in the month of March. Higher quit rates translate to higher labor bargaining power, increased confidence from workers, and increases the rate of pay increases.
Layoffs remain near the bottom of their historic range on both a total and private-only basis. There is no sign whatsoever here that the US labor market is weakening or that a recession may be imminent. This data is extremely lagging (it’s the second week of May and we are only now just got March stats), but this broadly confirms the extremely strong readings we’ve gotten from initial claims throughout this year; they remain near all-time lows relative to the size of the labor force and near the lowest levels in more than a generation on an absolute basis.
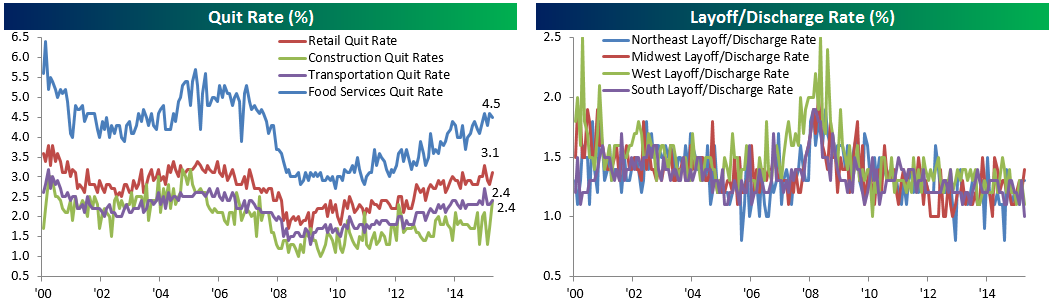
Finally, below we note quit rates in low pre-requisite labor market sectors that may be more susceptible to a secular tightening of labor markets. Notable is the spike in Construction quits to the highest rate of the current recovery while other quit rates basically continue to trend higher at the sector level. In terms of layoffs, in March the South saw an all-time low for firings relative to its labor force while Midwestern states saw a spike in firings; still, that regional rate remains well below recent highs let alone recessionary conditions.
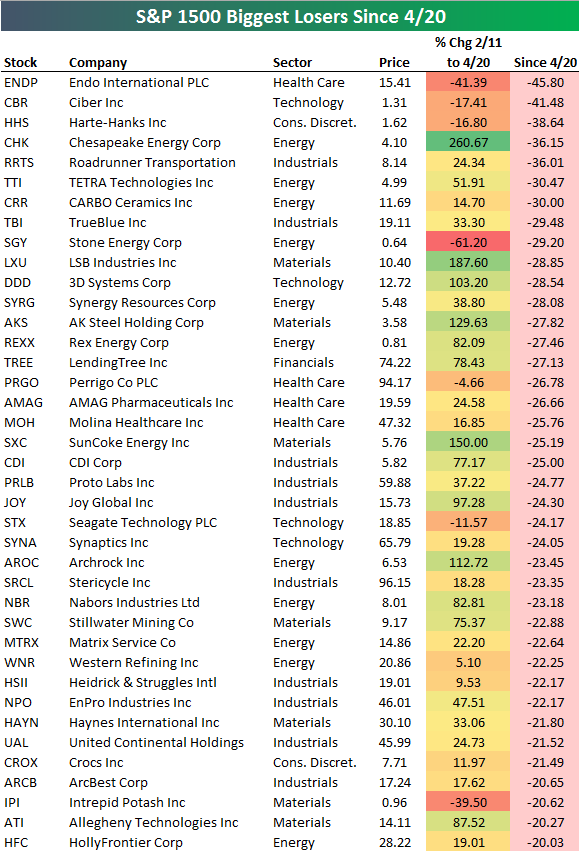
Biggest Losers (and Winners) Since the 4/20 High
The average S&P 1500 stock gained 22% from the February 11th low through April 20th. Since the market made its 2016 high on April 20th, however, the average stock in the S&P 1500 has pulled back roughly 2%. In an earlier post this morning, we noted that the stocks that gained the most during the 2/11-4/20 rally have gotten hit hard since 4/20. Below is a list of the stocks that have fallen the most since 4/20. Endo Pharma (ENDP) and Ciber (CBR) have both fallen more than 40%, while five other stocks have fallen 30%+. Chesapeake Energy (CHK) gained an almost unfathomable 260% from 2/11 through 4/20, but it has since fallen 36%! LSB Industries (LXU), 3D Systems (DDD), AK Steel (AKS), SunCoke Energy (SXC), and Archrock (AROC) all gained more than 100% from 2/11 through 4/20 but have fallen 20% since. Other notable stocks on the list of biggest losers since 4/20 include Lending Tree (TREE), Joy Global (JOY), Seagate Technology (STX), Stericycle (SRCL), United Continental (UAL), and Crocs (CROX).
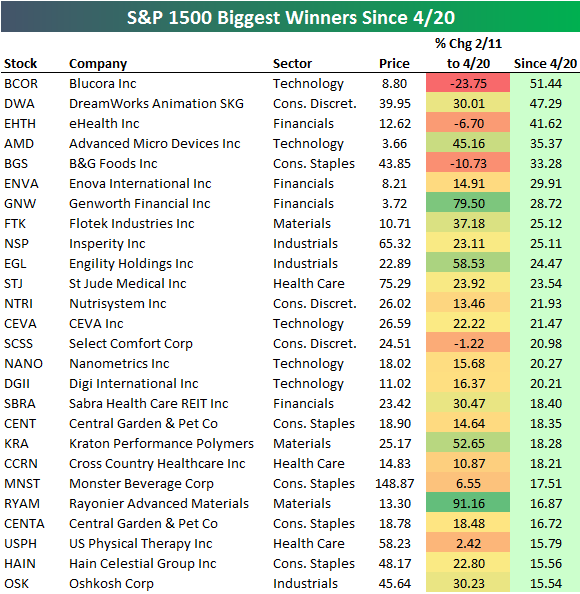
Not all stocks have fallen, though. Below is a list of 15%+ gainers since 4/20. Blucora (BCOR) has been the biggest winner with a gain of 51%, followed by DreamWorks (DWA) and eHealth (EHTH). Other notable winners include AMD, Insperity (NSP), St Jude Medical (STJ), Nutrisystem (NTRI), and Monster Beverage (MNST).
Dynamic Upgrades/Downgrades: 5/10/16
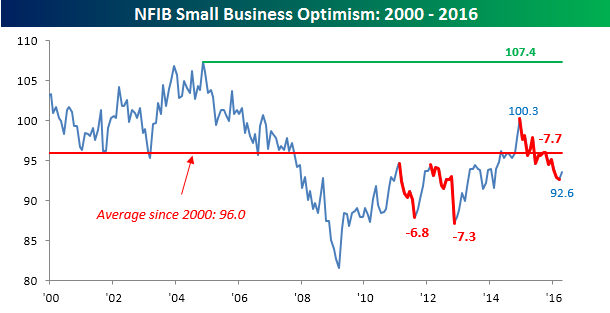
NFIB Bounces
“Measures of consumer optimism are also weak, offering no hope of significant gains in spending as the savings rate increases. There is no exuberance to be found, a flatness in optimism pervades the economy, consistent with the plodding growth characterizing this recovery.
There is no leadership in Washington, no articulation of a path to a better future, no evidence that policy-making is coordinated or focused on promoting growth or job creation. Important government institutions are mired in scandal and inaction, voters have lost confidence (20 percent of consumers think government policy is “good”, 41 percent think it is “poor”). The prospects that strong, unifying leadership will emerge after the election appear to be poor.”
That statement above really doesn’t give you a warm and fuzzy feeling towards the economy, does it? In spite of the weak commentary, today’s release of the monthly NFIB Small Business Optimism Index actually saw a slight bounce from last month. After making its largest peak to trough decline of the recovery, the index rose from 92.6 up to 93.6 in April, which was 0.6 above expectations. Even after this month’s bounce, the index remains well below its long-term average of 96.0 going back to 2000.
 Within this month’s report, the two biggest problems facing small business owners are the twin threats of Taxes and Government Red Tape, which were cited by 21% and 20% of respondents, respectively. Next on the list this month was Quality of Labor (12%), which moved into third place due to fewer business owners citing Poor Sales (11%) as their number one problem. In terms of labor issues, 46% of respondents reported that there were few or no qualified applicants available for the positions they were looking to fill. With fewer qualified applicants, business owners may find the need to ‘pay up’ for job candidates, and we saw some signs of this as 6% of business owners cited labor costs as their number one problem (up from 5% last month). Finally, in this month’s Bespoke Consumer Pulse report, we saw a meaningful uptick in overall healthcare costs, including insurance premiums. That increase in insurance costs was also evident in this month’s NFIB survey where the percentage of respondents citing “cost of insurance” increased from 8% to 10%.
Bouncers Fade
Start a 14-day no obligation free trial to our premium research.
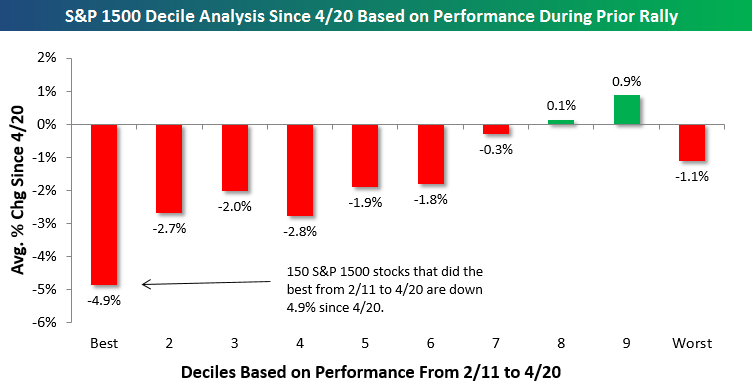
Stocks that did the best during the market’s surge from February 11th through April 20th have gotten slammed over the last few weeks. Below we have broken the S&P 1500 (which contains large-caps, mid-caps, and small-caps) into 10 groups (deciles) of 150 stocks each based on stock performance during the 2/11-4/20 market rally. Decile 1 marked as “Best” contains the 150 stocks that went up the most during the rally, while decile 10 marked as “Worst” contains the 150 stocks that went up the least during the rally. For each group, we show the average stock’s percentage change since the April 20th high.
As shown, the 150 stocks that surged the most during the rally are down an average of 4.9% since April 20th. That’s by far the worst performance of any decile. At the same time, the groups of stocks that went up the least during the market’s rally are outperforming, with deciles 8 and 9 actually averaging gains.
For anyone that got long stocks that were showing the most relative strength in mid-April, it has been a painful few weeks watching them get slaughtered. At the same time, the stocks that went nowhere during the market’s rally are all of a sudden heating up again. This type of rotation based on performance can be extremely tough on active investors, and it’s not going to help the already high percentage of funds out there that are underperforming their benchmarks.