Bespoke Stock Scores: 5/17/16
Chart of the Day – Housing Starts vs Housing Stocks
Pulse — Google Search Trends Report (5/17/16)
Today we are introducing a new Pulse add-on report called “Google Search Trends”. Google Trends (try it yourself here) allows you to track Internet search interest over time for any search term. For products, services, retailers and other consumer-related entities, this provides enormous insight into historical and current interest. Consumers search for products they’re interested in purchasing, airline tickets they’re looking to book, and stores and restaurants they want to visit. In this report we provide Google Trends search interest charts for every company, website or product that’s covered in our monthly Pulse survey. While search trends alone don’t form a full thesis, we think it can certainly be an input.
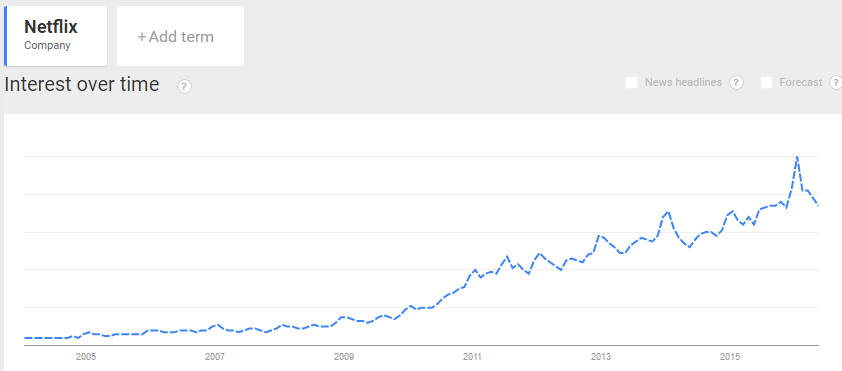
Below is an example search trends chart for Netflix. As you can see, Netflix continues to make new highs in search even as it ages as a company.
If you’d like to see these results for dozens of other consumer-related stocks and products, start a 30-day Pulse add-on trial below.
Bespoke Consumer Pulse Add-On — Monthly $39 (with 30-day free trial)
Bespoke Consumer Pulse Add-On — Annual $365 (with 30-day free trial)
Mixed Housing Data
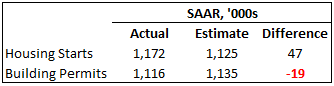 After big declines last month, housing data for the month of April (in terms of Housing Starts and Building Permits) showed a nice rebound. Relative to expectations, though, the data was mixed. As shown in the table to the right, Housing Starts exceeded expectations by 47K which was the biggest beat since last September’s report. Building Permits, however, missed consensus expectations by 19K, marking the third straight weaker than expected report.
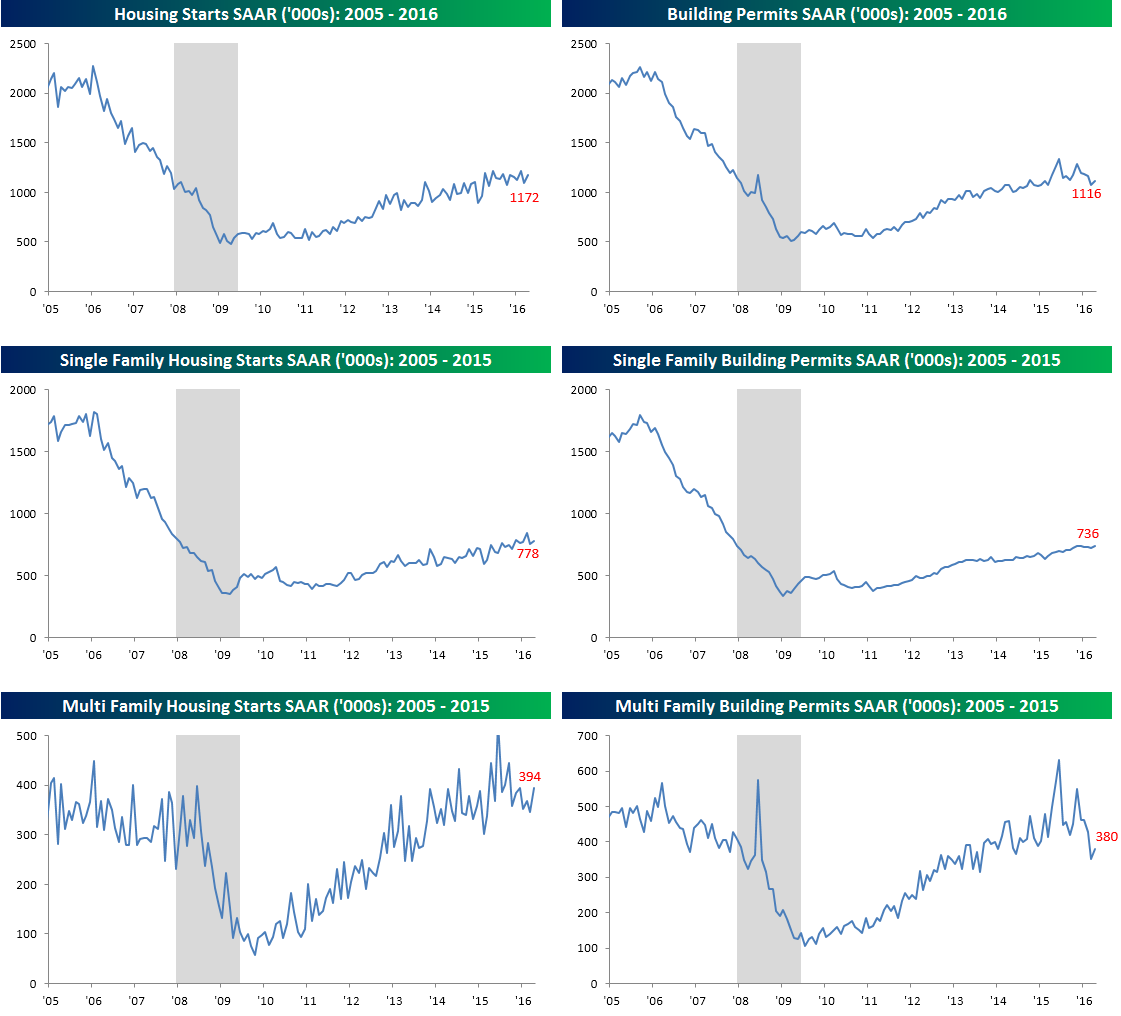
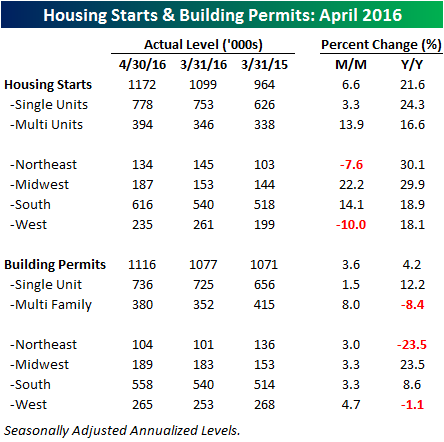
The table below breaks down this month’s Housing Starts and Building Permits reports by size of unit and region. For both Starts and Permits, the rebound this month was driven by multi-family units, which rose 13.9% and 8.0%, respectively. On a y/y basis, though, multi-family starts are up over 16%, while permits are down 8.4%. As shown in the charts, multi-family permits are down sharply from their peak readings seen towards the middle of 2015. Part of this is due to some give back as multi-family units saw a surge ahead of the expiration of some tax breaks in New York, and hence the 23.5% y/y decline in northeast permits.
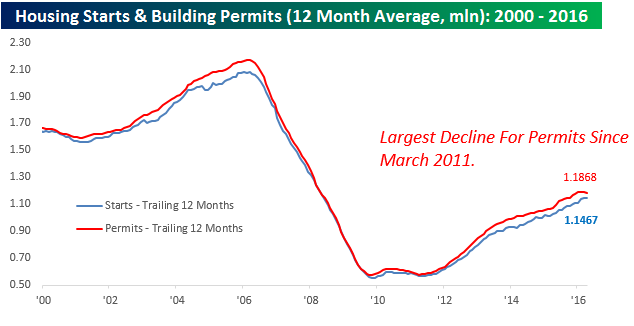
While Housing Starts and Building Permits tend to have some month to month volatility, overall momentum appears to be slowing somewhat. The chart below shows the 12-month moving average of both headline Housing Starts and Building Permits going back to 2000. Both moving averages declined modestly this month, with the drop in Permits being the largest since March 2011, and keep in mind that the two months of run-up ahead of the tax break expiration are still part of the 12-month moving average.
ETF Trends: US Sectors & Groups – 5/16/16
Bespoke Stock Seasonality: 5/16/16
Chart of the Day: Hubbell Inc. (HUBB)
B.I.G. Tips – S&P 500 Treading Water
Since peaking out at 2,130.82 (on a closing basis) last May, the S&P 500 has seen its share of volatility. Despite the big swings, though, the index is currently within 3% of that all-time closing high from one year ago. Come this weekend, though, the S&P 500 will have gone a year without making a new 52-week high. While that may not sound like much, given that 2014 saw the fifth most daily closes at an all-time high on record, it has been a bit of an adjustment period for investors.

In a B.I.G. Tips report just sent to Bespoke Premium and Bespoke Institutional members, we looked at prior periods where the S&P 500 went at least a year without closing at a 52-week high. For each period, we also included an analysis of the S&P 500’s performance in the weeks and months following.
See the full B.I.G. Tips report by signing up for a monthly Bespoke Premium membership now. Click this link for a 10% discount ($89/month).
B.I.G. Tips – The Bespoke Death By Amazon Indices Update 5/16/16
Social Media Stock Performance
Five years have now passed since the first of the three big public social media companies IPOd. LinkedIn (LNKD) priced on May 18th, 2011, and since then the stock has gained 182% from its IPO price of $45/share.
Almost exactly a year after LinkedIn went public, Facebook (FB) priced on May 17th, 2012 at $38/share. Four years later, Facebook shares are up 215% from that $38 IPO price, but in case you forgot, the stock experienced a serious draw-down in its first four months as a public company. While FB opened up huge on Friday, 5/18/12, it actually closed just 23 cents above its $38 IPO price that day, and the only reason it closed up was due to serious support that came in from its underwriters. The support from underwriters could only last so long, though, and by September 4th, 2012, FB had fallen 53% from its IPO price to close that day at $17.72. In hindsight, FB’s sub-$20 share price was such a perfect buying opportunity, but at that point there were a lot of questions surrounding the company and its mobile strategy. In any case, since its September 4th, 2012 low, FB has been an absolute beast, gaining 565%.
Following on the heels of success for LinkedIn and Facebook (eventually), Twitter (TWTR) went public on November 7th, 2013, pricing at $26 the night before. TWTR likely would have IPOd earlier were it not for Facebook’s initial struggles. It may not feel like it — it sure doesn’t to us — but TWTR has already been public for two and a half years.
Below is a chart showing the performance of LNKD, FB and TWTR from their IPO prices. What’s crazy is that TWTR gained more than both LNKD and FB in its first couple months of trading. By December 26th, 2013, after just 34 days of trading, TWTR had gained 182% from its IPO price to close that day at $73.31/share. Since then, it has been all downhill for TWTR. By August 2015, TWTR had given up all of its post-IPO gains, and as of this morning the stock is down 45.76% from its $26 IPO price. From its high of $73.31, TWTR is down 81%.
