ETF Trends: International – 6/1/16
Gold has finally fallen off the top of the worst performers list, which is instead populated by EMs and the UK where a 2-day swoon in GBPUSD has hurt stocks traded in GBP. Natural gas is up a frankly astounding 10.77% over the last five days, with India and Metals & Mining also performing well despite weakness in iron ore, steel, and copper markets. Another unlikely suspect in the top 20: retail. After hand-wringing galore a few weeks ago on a slate of poor earnings from retailers, XRT has rallied 3% over the last week, just outside our top 10 best performing ETFs over that period.

Bespoke provides Bespoke Premium and Bespoke Institutional members with a daily ETF Trends report that highlights proprietary trend and timing scores for more than 200 widely followed ETFs across all asset classes. If you’re an ETF investor, this daily report is perfect. Sign up below to access today’s ETF Trends report.
See Bespoke’s full daily ETF Trends report by starting a no-obligation free trial to our premium research. Click here to sign up with just your name and email address.
Bespoke’s Consumer Pulse Report — June 2016
You do not currently have access to this report. Sign up for a 30-day free trial to our Pulse add-on service here.
Chart of the Day: Economic Indicator Diffusion Index
Our Economic Indicator Diffusion Index measures the pace at which economic indicators are coming in ahead of (or below) consensus economist estimates over a 50-day period, and it provides a nice illustration of how the economy is playing out compared to expectations. Positive readings indicate an economy surprising to the upside, while negative readings are representative of an economy failing to live up to expectations.
In today’s Chart of the Day sent to paid research subscribers, we provided an update to our monthly Economic Indicator Diffusion Index. In today’s update, we discuss recent trends in the index and how various readings are likely to be interpreted by the market. Sign up for a 14-day free Bespoke research trial below to receive instant access to our Chart of the Day plus everything else we have to offer.
Amazon.com (AMZN) New All-Time High
Amazon.com (AMZN) is currently trading at a new all-time high at just under $725/share. Since making an intraday low of $474 on February 9th, the stock has soared 53%.

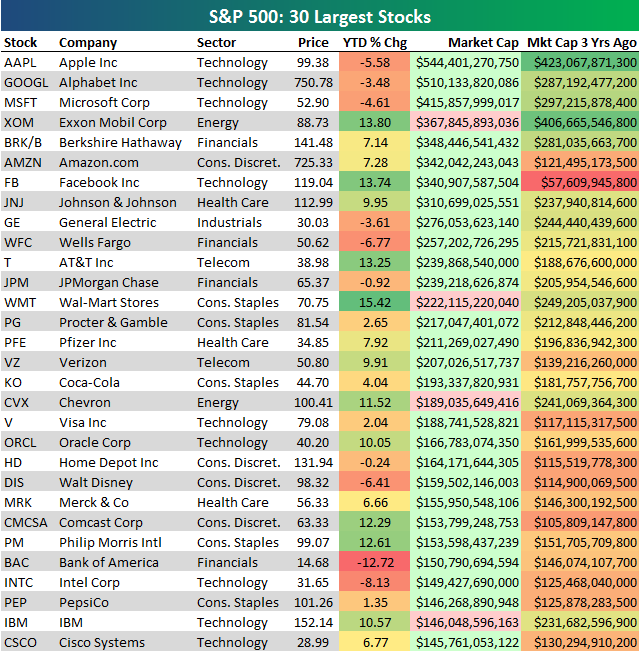
A gain of 53% in less than four months is remarkable, and you usually only see those type of moves in smaller-cap stocks. Amazon (AMZN), however, has made this move as one of the ten largest stocks in the U.S. In fact, as of this morning, AMZN ranks as the sixth largest company in the S&P 500. Sandwiched in between Berkshire Hathaway (BRK/B) at $348.4 billion and Facebook (FB) at $340.9 billion, AMZN’s market cap currently sits at $342 billion.
Below is an updated look at the 30 largest stocks in the S&P 500. Slowly but surely, big Tech companies have come to dominate the top of the list. The three largest stocks are all in the Tech sector (AAPL, GOOGL, MSFT), and Amazon (AMZN) and Facebook (FB) rank sixth and seventh. While AMZN is officially a Consumer Discretionary name, we view it as a Tech company just as much. Meanwhile, Wal-Mart (WMT) — Amazon’s bricks and mortar competitor — has seen its market cap drop from $249 billion down to $222 billion over the last three years, ranking as just the 13th largest company in the S&P right now.
ISM Bucks the Trend of Regional Fed Surveys
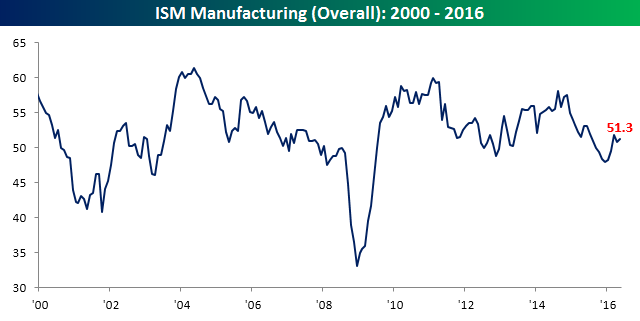
After a series of weaker than expected regional Fed surveys that showed contractionary business environments for the regions that covered, the release of the May ISM Manufacturing report bucked the trend. Not only did the headline index remain in growth territory (above 50), but it also exceeded economist expectations (50.3), rising to a level of 51.3 from last month’s reading of 50.8. After five straight months towards the end of 2015 and into early 2016, the headline ISM Manufacturing index has now been above 50 for three straight months.
Looking at the internals of the report gave a mixed picture. Of the ten components to the report, breadth was biased to the downside with three increases, four decliners, and three unchanged. The biggest decliners relative to April Backlog Orders (-3.5) and Production (-1.1), while the biggest increases came from Supplier Deliveries (+5.0), Prices Paid (+4.5), and Customer Inventories (+4.0). Relative to last May, the components were evenly split between gains and losses at five.

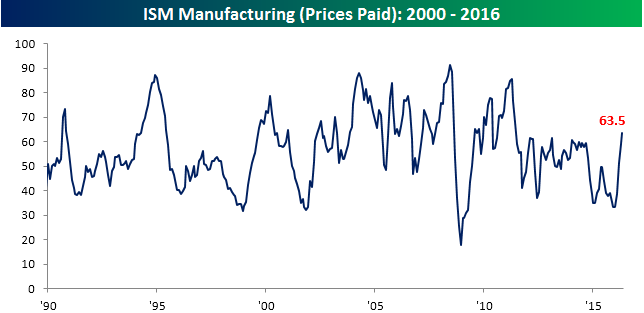
As mentioned above, on both a m/m and y/y basis, Prices Paid saw one of, if not, the largest increases. After these increases, the level for this component is now at 63.5, which is the highest level since June 2011.
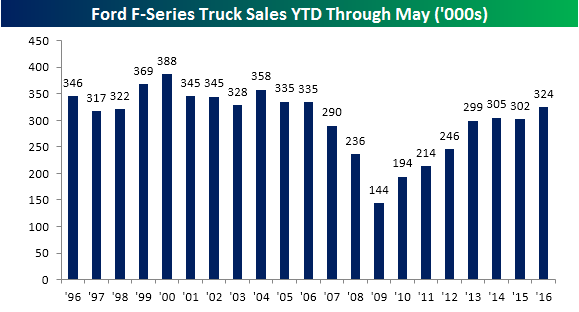
Ford Truck Sales Increase 9% Y/Y in May
While Auto sales have been a bit of a disappointment so far this morning, Ford did manage to post good numbers in its sales of F-Series trucks. During the month of May, the company reported monthly sales of 67,412 F-series trucks, which was up 9% relative to last May’s raw total. As shown in the chart, though, while sales in May were up relative to last year, they are still down from levels in 2014 and 2013.
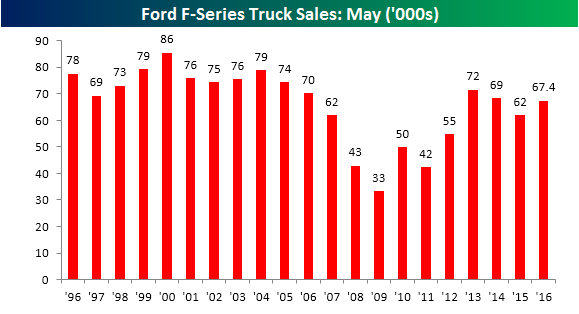
With this May’s sales, total sales for 2016 are at 324,307 vehicles, which is up 7.4% from last year’s YTD total of 302.009. While May’s total sales were still below levels from 2014, YTD sales for 2016 are now at their highest level since 2006.
Chrysler Surges, Ford & GM Plunge, Auto Sales Tracking A Miss
With Fiat-Chrysler USA, Ford, and GM reported, we now have auto sales figures for ~45.8% of the US auto industry for the month of May. Below, we show our tracker for sales. We use seasonal adjustment factors and current market share reported to update the estimate for final sales that we are tracking as manufacturers report throughout the day. At this point, sales are tracking a 16.84mm SAAR versus the 17.3mm SAAR estimate from economists. That said, it’s still early, and we’ll have to wait and see more brands report before we can be confident what the final number will be.
Update 10:53 AM: With Mazda, Audi, Nissan, and VW reported, we’re up to 60% of market share reported and sales are still tracking below 17.1mm SAAR, versus 17.3mm estimated.
Update 11:25 AM: We now have an update from Toyota, which reported a 9.6% decline in sales YoY. That brings our tracker down to 16.98mm SAAR based on market share reported and seasonal adjustment factors; that’s versus 17.3mm expected as-of this morning. 74% of the US new auto market has reported as-of Toyota’s announcement.
Update 2:17 PM: Until a few minutes ago, it looked like auto sales would miss with a track of 17.185 mm SAAR as-of Kia’s report at 1:33 PM. However, Hyundai (the last major manufacturer to report, leaving only Volvo, Jaguar, and Maserati left out) reported a gain, with sales up 11.6% YoY. That was enough to push our tracking to 17.319mm SAAR for total vehicle sales in May, just a hair above the estimated 17.3mm SAAR rate. Because we are using a model that does not differentiate between car and light truck sales, relying instead on aggregate seasonal and trading day adjustments, this could differ very slightly from the final numbers reported by Auto Trader or Ward’s Auto later this afternoon. 17.312mm SAAR is not a weak number, especially considering the terrible results from Ford (-5.9% YoY), GM (-18.0% YoY) and Toyota (-9.6% YoY), which collectively make up about half of US market share.

The Closer 5/31/16 – “Spending Up, Sharpes Down”
Looking for deeper insight on global markets and economics? In tonight’s Closer sent to Bespoke clients, we take a look at a strong personal consumption reading this morning. We also include wage and salary, savings rate, and inflation data released by the BEA today. The Case-Shiller home price indices for the month of March get some attention, followed by a look at “risk parity” fund performance of late. Finally we provide a rundown of the 38 major global economic indicators due out over the next 24 hours.

The Closer is one of our most popular reports, and you can sign up for a trial below to see it and everything else Bespoke publishes free for the next two weeks!
Click here to start your no-obligation free Bespoke research trial now!
ETF Trends: US Sectors & Groups – 5/31/16
Chinese shares rallied today on hopes that MSCI would include onshore Chinese listings in its global indices. Biotech continues to trade well over the last few days as do mid-cap and small-cap growth stocks. Gold remains the most painful trade at the moment with the 7 worst performing ETFs we track over the last week all involving some kind of gold exposure. Finally, notable: the two most overbought ETFs we track are both short volatility products that are basically inverse VIX funds.
Bespoke provides Bespoke Premium and Bespoke Institutional members with a daily ETF Trends report that highlights proprietary trend and timing scores for more than 200 widely followed ETFs across all asset classes. If you’re an ETF investor, this daily report is perfect. Sign up below to access today’s ETF Trends report.
See Bespoke’s full daily ETF Trends report by starting a no-obligation free trial to our premium research. Click here to sign up with just your name and email address.