Bespoke Stock Scores: 6/14/16
B.I.G. Tips – Headline Beat in Retail Sales
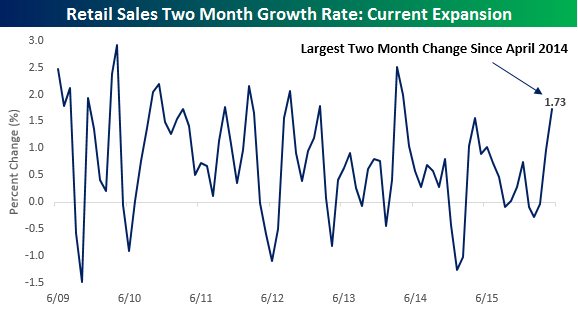
 Retail sales for the month of May were released earlier this morning and at the headline level came in higher than expected for the second straight month, rising by 0.5% vs. consensus expectations for growth of 0.3%. Ex Autos and Ex Autos and Gas, the report was not as strong as the headline, but still managed to match expectations. On a two-month basis, now, retail sales have risen by 1.73%, which is the strongest two-month growth rate since April 2014.
In a B.I.G. Tips report just sent to Bespoke Premium and Bespoke Institutional members, we went into detail on this month’s report highlighting which areas of the sector were showing strength and which were weak.
See the full B.I.G. Tips report by signing up for a monthly Bespoke Premium membership now. Click this link for a 10% discount ($89/month).
NFIB Better Than Expected: Poor Sales an Increasing Problem
Tuesday’s report on Small Business Optimism from the NFIB showed a slight increase from last month, rising to 93.8 relative to expectations of 93.6. While the index has now increased for two straight months, it follows what was the largest peak to trough decline of the current economic cycle. Additionally, at its current level of 93.8, the NFIB index of small business optimism remains well below its long-term average of 96.0. Perhaps the NFIB summed it up best in their release when they said, “The Index of Small Business Optimism increased 0.2 points to 93.8, positive but don’t start writing home about it.”

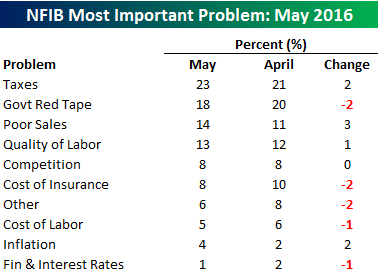
The table below shows what small business owners consider to be their number one problem. Topping the list this month, as it usually does, is Taxes at 23%. That’s up from 21% in April, and it’s the highest reading since June 2015. While Taxes are becoming an increasingly large problem, Government Red Tape dropped to 18% from 20%. The biggest increase this month was Poor Sales, which was cited by 14% of all respondents and tied for its highest reading since April 2014.
Dynamic Upgrades/Downgrades: 6/14/16
The Closer 6/13/16 – “The Death of The AAA Corporate”
Looking for deeper insight on global markets and economics? In tonight’s Closer sent to Bespoke clients, we catalog the end of the AAA corporate issuer as MSFT’s purchase today may put that company’s AAA rating at risk.

The Closer is one of our most popular reports, and you can sign up for a trial below to see it and everything else Bespoke publishes free for the next two weeks!
Click here to start your no-obligation free Bespoke research trial now!
Case of the Mondays Continues
The S&P 500 finished lower for a third consecutive trading day to start the week. After dropping 0.92% on Friday, the index fell another 0.81% today.
Below is an updated look at the S&P 500’s performance by weekday so far this year. As shown, if it weren’t for Mondays, the market would be doing much better this year! The S&P has averaged a decline of 0.12% on Mondays in 2016, which has been the worst trading day of the week. And if we didn’t have Tuesdays and Fridays — the only two trading days that have averaged gains this year — things would look a whole lot worse.

ETF Trends: Hedge – 6/13/16
Below is a list of the 20 best and 20 worst performing ETFs over the last week. Precious metals continue to rally, as do Treasuries with EDV and TLT breaking out over the last few days. Other carry plays like REITs and Utilities have also outperformed along with a rallying Japanese yen. European stocks continue to underperform while volatile biotech is now a laggard. Solar stocks have also lagged significantly while all manner of international stocks have gotten weighed down by currency weakness and poor performance from Europe.

Bespoke provides Bespoke Premium and Bespoke Institutional members with a daily ETF Trends report that highlights proprietary trend and timing scores for more than 200 widely followed ETFs across all asset classes. If you’re an ETF investor, this daily report is perfect. Sign up below to access today’s ETF Trends report.
See Bespoke’s full daily ETF Trends report by starting a no-obligation free trial to our premium research. Click here to sign up with just your name and email address.
Chart of the Day: 30%+ Two-Day VIX Spike
Below is a six-month chart of the VIX volatility index. As you can see, the VIX has surged over the past week, and it has broken above the top of a 3-month sideways range in the process.
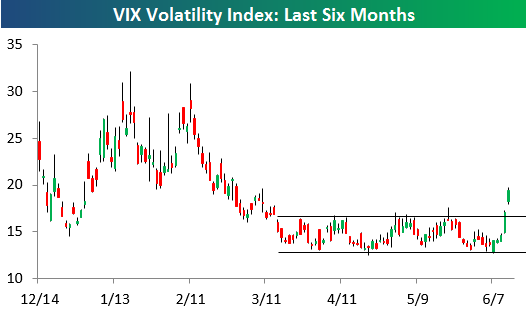
In today’s Chart of the Day sent to paid subscribers, we take a look at huge short-term spikes in the VIX and what it has historically meant for stocks in the coming days and weeks. To view the report, please start a 14-day free trial below.
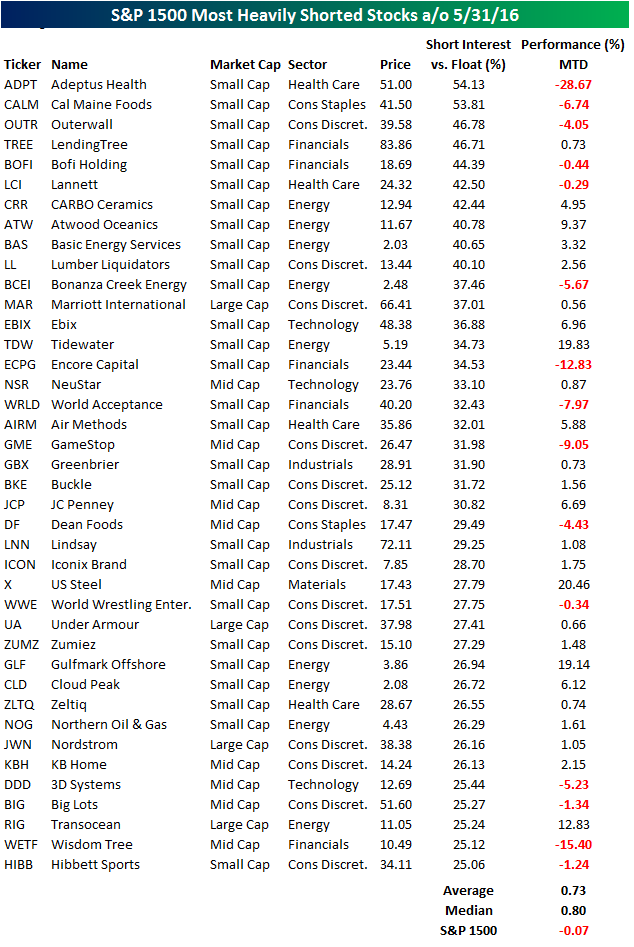
S&P 1500 Most Heavily Shorted Stocks
Short interest figures from the NYSE and Nasdaq were released last week, and we have just sent our regular update of the figures to Bespoke Premium and Bespoke Institutional clients (click here to see it with a 14-day no-obligation free trial). Our S&P 1500 Short Interest Report is a detailed look at key trends in short interest levels for the overall market, different market cap ranges, sectors, industry groups, and individual stocks (sample here). The table below is from our most recent update, and it shows every stock in the S&P 1500 that has more than 25% of its free-floating shares sold short through the end of May. In this update, there were 40 stocks in the S&P 1500 fitting the criteria. In terms of sector representation, more than half of the stocks listed are from the Consumer Discretionary (14) and Energy (9) sectors, and the only two sector that aren’t represented are Utilities and Telecom Services.
For each stock listed below, we have also included its performance so far in June. With an average gain of 0.73% (median: +0.80%), the most heavily shorted stocks are slightly outperforming the S&P 1500’s decline of 0.07%. In terms of breadth, 25 of the stocks listed have seen gains so far this month, while 15 are down. This is somewhat of a reversal of the trend that we saw back in May where the most heavily shorted stocks underperformed the S&P 1500 by a wide margin. While the most heavily shorted stocks are slightly outperforming, the most heavily shorted stock in the index is making a mint for investors. With 54% of its float sold short, shares of Adeptus Health (ADPT) are down nearly 29% just this month. Besides ADPT, just two other stocks (Wisdom Tree and Encore Capital) on the list are down more than 10% in June. While the shorts are making a mint on these three stocks, they are getting hit hard on names like US Steel (X), Tidewater (TDW), Gulfmark (GLF), and Transocean (RIG), which are all up by more than 10% already in June.
Retailer Trading Range Screen
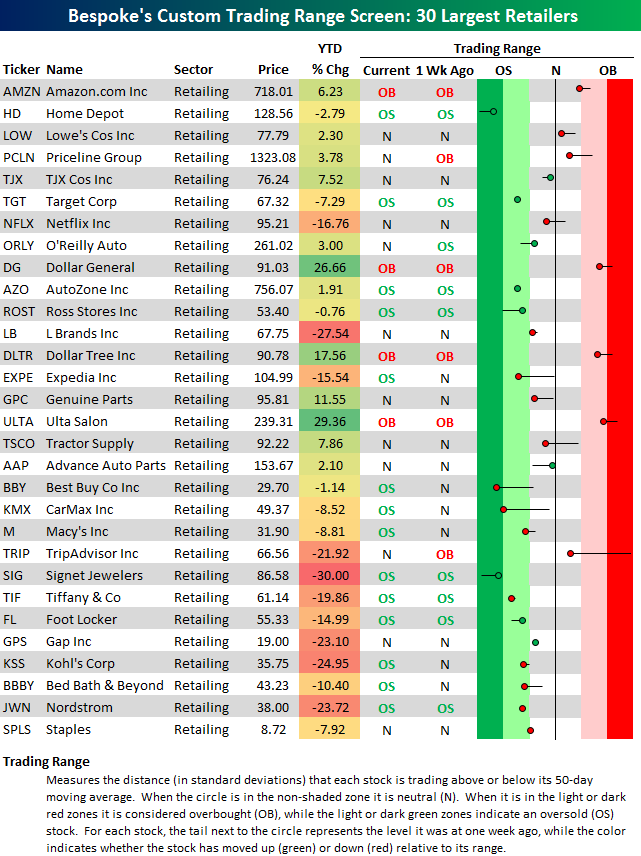
Below we have run our trading range screen on the 30 largest S&P 500 retailers. For each stock, the dot represents where it’s currently trading within its range, while the tail end represents where it was trading one week ago. The black vertical “N” line represents each stock’s 50-day moving average, and moves into the red or green zone are considered overbought or oversold.
Brick-and-mortar retailers went through a rough patch when they reported earnings in mid-May. The group bounced back a bit towards the end of May into the first few days of June, but they’ve pulled back a bit over the last week. Of the thirty largest retail stocks, fourteen are currently oversold while just four are overbought. Amazon.com (AMZN), Dollar General (DG), Dollar Tree (DLTR) and Ulta Salon (ULTA) are the four overbought stocks, but they have all pulled back from even more overbought levels a week ago.
Home Depot (HD), Best Buy (BBY), CarMax (KMX), and Signet Jewelers (SIG) are the most oversold retailers. When looking at oversold stocks that may be due for upside mean reversion, we like to focus on ones that have already “turned the corner,” or companies that are in the oversold region but have moved higher within their trading range over the last week. Of the four oversold names just mentioned, Home Depot and Signet are the only two that fit this criteria.
In the screen below, we also include each stock’s year-to-date percentage change. Notice any trends?