US Gains Global Share
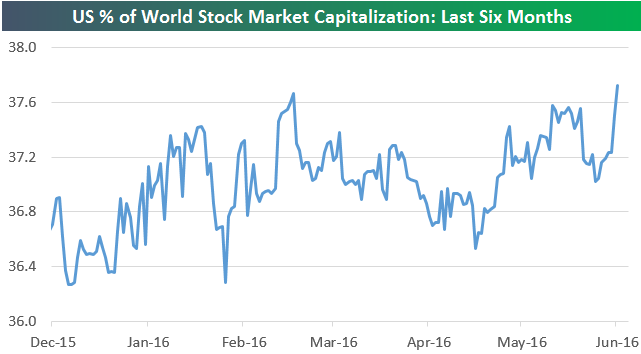
Below is a look at the percentage of global stock market capitalization that the US equity market makes up (from Bloomberg). As shown, just recently the United States’ share of world market cap broke out to a six-month high, pushing up to 37.73% as of the close yesterday. That means US equity markets have been outperforming the rest of the world and taking share in the process.
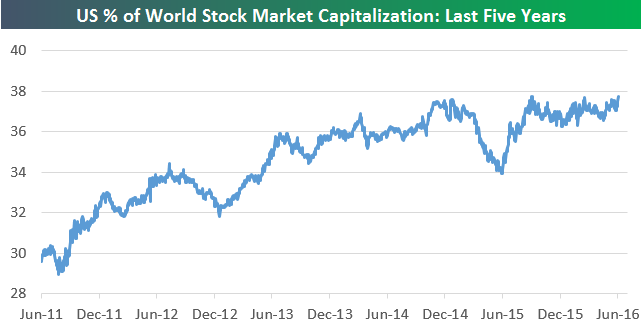
Below is an expanded version of the chart above looking back five years. Back in 2011, US equities made up less than 30% of global market cap. We’ve seen a steady trend higher in US share over the years, but since late 2014, we’ve been stuck in a sideways range with 38% acting as resistance.
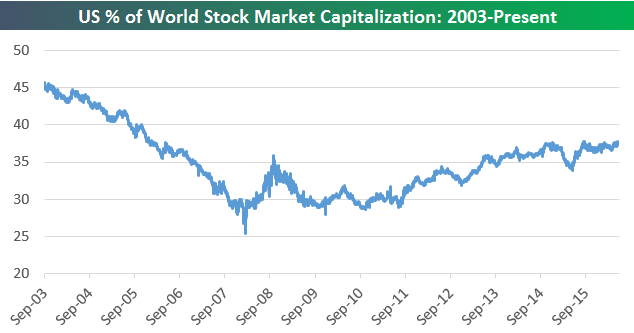
Finally, the chart below shows US share of global market cap going back to 2003 (when data begins). Back in 2003, the US made up a much larger piece of the global stock market pie — 45%. And in the years and decades prior to that, it was even higher. From 2003 all the way to the start of the financial crisis, the US lost share as emerging markets like China, India, and Brazil saw their economies grow dramatically and the dollar weakened. It was peak globalization hype, and The World Is Flat was all the rage. Since the financial crisis shook the world, though, we’ve seen the US pick up share slowly and steadily over the years.
Below is a look at the year-to-date performance of 75 country stock markets around the world (in local currency). The main thing you’ll notice is that four G7 countries rank in the bottom ten in terms of stock market performance this year. Canada and the US are the only G7 countries in the black YTD, while Italy is down more than any other country at -22%. Also, two of the four BRIC countries rank in the top five (Russia and Brazil).
Overall, the average year-to-date change of all 75 country stock markets shown is slightly negative at -0.58%. The median YTD change is even weaker at -2.41%, and only 43% of countries are in positive territory. Not a great year for stocks so far, but also could be a lot worse.
If you’ve never had a chance to check out Bespoke’s premium stock market research, we’d urge you to do so by starting a 14-day no-obligation free trial today. We’re confident you’ll find our paid content extremely useful!
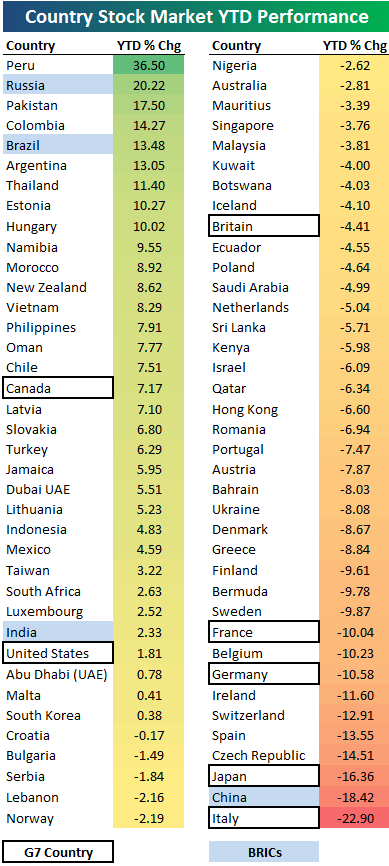
Chart of the Day: 6/15/16
ETF Trends: International – 6/15/16
Below is our daily list of the twenty best and twenty worst performing ETFs over the last five trading days. Natural gas continues to trade very well along with Treasuries and gold. The USD index has risen notably over the last week or so, but overall ETFs we track haven’t turned in much of a performance; the 20th best performer is up 36 bps while the 20th worst performer is down almost 7%. While Europe is bouncing today, it’s been a disaster over the past week as equity ETFs from across the continent have taken 7-9% headers in a profound leg lower for European stocks.

Bespoke provides Bespoke Premium and Bespoke Institutional members with a daily ETF Trends report that highlights proprietary trend and timing scores for more than 200 widely followed ETFs across all asset classes. If you’re an ETF investor, this daily report is perfect. Sign up below to access today’s ETF Trends report.
See Bespoke’s full daily ETF Trends report by starting a no-obligation free trial to our premium research. Click here to sign up with just your name and email address.
Dynamic Upgrades/Downgrades: 6/15/16
B.I.G. Tips – A Global Flush
As the 6/23 referendum on Britain’s membership in the European Union gets ever so closer, not only have investors in the UK and Europe become increasingly skittish, but so too have investors all over the world. Over the last four trading days through Tuesday, we have basically seen a global flush of stocks.
In a B.I.G. Tips report just sent to Bespoke Premium and Bespoke Institutional members, we went into detail on just how weak the last four days have been on a global basis relative to other periods over the last ten years. Forward equity market returns following events of similar magnitude in the past have been extreme. Have they been extreme to the upside or the downside? Read the report to find out!
See the full B.I.G. Tips report by signing up for a monthly Bespoke Premium membership now. Click this link for a 10% discount ($89/month).
The Closer 6/14/16 – “Prices Up, Small Biz Sideways”
Looking for deeper insight on global markets and economics? In tonight’s Closer sent to Bespoke clients, we update evolution of US import prices and the impact on terms of trade for the USD. We also break down today’s NFIB Small Business Optimism report, preview the FOMC policy decision tomorrow, and set the table for a busy 24 hours on the global data front.

The Closer is one of our most popular reports, and you can sign up for a trial below to see it and everything else Bespoke publishes free for the next two weeks!
Click here to start your no-obligation free Bespoke research trial now!
Global Markets Crushed
Below is a look at recent movements in global equity markets using our trading range screen of the 30 largest country ETFs. For each ETF, the dot represents where it’s currently trading within its range, while the tail end represents where it was trading one week ago. The black vertical “N” line represents each ETF’s 50-day moving average. When the dot is to the right of the “N” line, the ETF is above its 50-DMA. When the dot is to the left of the “N” line, the ETF is below its 50-DMA. Moves into the red or green zones are considered overbought or oversold.
Last week at this time, 17 of 30 country ETFs were overbought, while none were oversold. After five days of carnage — especially in Western Europe — not one country ETF remains overbought, and 14 of 30 are now oversold! France (EWQ), Germany (EWG), Netherlands (EWN), Switzerland (EWL), and the UK (EWU) all went from overbought to extreme oversold territory in a week.

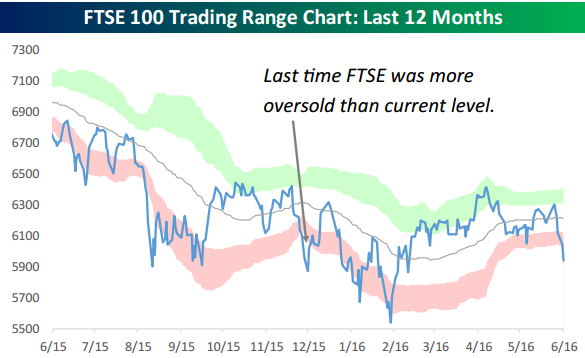
Chart of the Day: FTSE 100 Down 1%+ Four Days in a Row
The UK’s FTSE 100 has fallen more than 1% for four consecutive trading days! This has taken the index close to three standard deviations below its 50-day moving average. In our trading range chart of the index below, you can see that the UK’s stock market hasn’t been this oversold since last December.
In today’s Chart of the Day sent to paid subscribers, we look at prior 4-day losing streaks for the FTSE 100 where the index fell more than 1% on each day. Does the index typically bounce back or continue lower? To view the report, please start a 14-day free trial below.
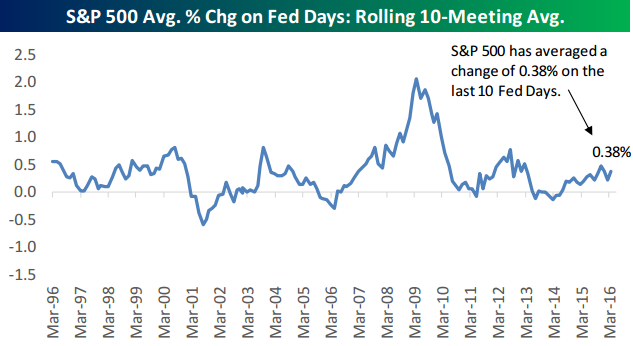
B.I.G. Tips – Market Performance on Fed Days
Tomorrow is yet another Fed Day — the fourth of 2016. Below we show the S&P 500’s average one-day change on Fed Days on a rolling 10 Fed-Day basis. As shown, over the last 10 Fed Days, the S&P 500 has averaged a gain of 0.38%.
In a B.I.G. Tips report just sent to Bespoke Premium and Bespoke Institutional members, we take a detailed look at the market’s historical performance on Fed Days.
See the full B.I.G. Tips report by signing up for a monthly Bespoke Premium membership now. Click this link for a 10% discount ($89/month).
ETF Trends: US Sectors & Groups – 6/14/16
Below is our daily list of the twenty best and twenty worst performing ETFs over the last five trading days. It’s rare that inflation-sensitive assets like commodities (silver, natural gas, gold) rally at the same time as long-term bonds (which are typically inflation sensitive), but that’s what has happened over the past 5 sessions. For that matter, it’s also rare to see commodities and the USD both move up, but that has also happened. Meanwhile, in Europe, it’s pure carnage as Italy, Spain, France, and the megacaps in the Stoxx 50 are all down over 8.5%. Solar stocks and energy stocks have also underperformed sharply.
Bespoke provides Bespoke Premium and Bespoke Institutional members with a daily ETF Trends report that highlights proprietary trend and timing scores for more than 200 widely followed ETFs across all asset classes. If you’re an ETF investor, this daily report is perfect. Sign up below to access today’s ETF Trends report.
See Bespoke’s full daily ETF Trends report by starting a no-obligation free trial to our premium research. Click here to sign up with just your name and email address.