The BESPOKE REPORT — 6/17/16
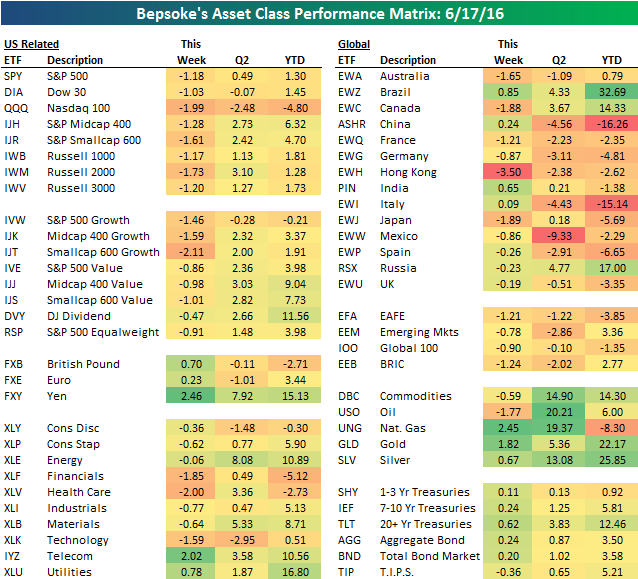
Below is a look at the recent performance of various asset classes using key ETFs tracked by Bespoke on a daily basis. The left side of the matrix is made up mostly of US equity ETFs, while the right side is made up of foreign equity market ETFs, commodity ETFs, and Treasury ETFs. US equities fell 1%+ across the board this week, with Health Care (XLV), Financials (XLF) and Technology (XLK) leading the way lower. These three sectors are the largest three sectors in the S&P, so they impacted the cap-weighted indices heavily. Telecom and Utilities were actually higher on the week, while the remaining five sectors were down marginally.
In the matrix, the darker the green shading, the better the performance. It’s been a few years since the commodities section of our matrix had the darkest green shading, but this asset class has finally staged a comeback in 2016.
Each week, Bespoke sends clients across all of its subscription levels the Bespoke Report newsletter. If you’re looking for Bespoke’s analysis of current market internals, economic data, earnings beats and misses, individual stock ideas, and more, the Bespoke Report has it all.
Continue reading this week’s Bespoke Report by starting a 14-day free trial to our paid content below.
Have a great weekend!
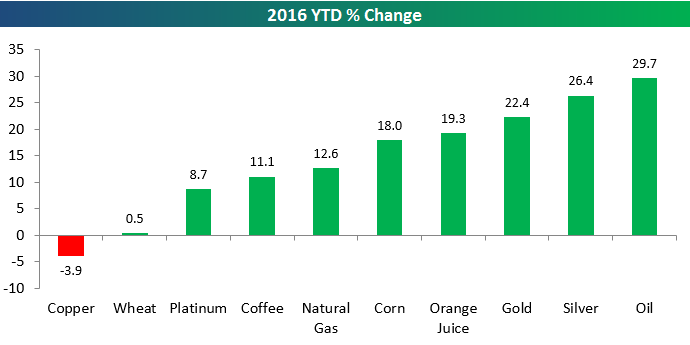
Commodities Having a Strong 2016
After a brutal 2014 and 2015, commodities are finally in the green again this year. As shown below, all but one of the ten major commodities highlighted in our year-to-date performance chart are up. Oil is up the most with a gain of 29.7%, followed by silver at 26.4% and gold at 22.4%. Orange juice, corn, natural gas and coffee are all up double-digit percentage points as well, while platinum is up 8.7% and wheat is up 0.5%. Copper is the one commodity in the red with a decline of 3.9%.
Start a 14-day no-obligation free trial to Bespoke’s research platform to see additional commodities analysis.
Bespoke Weekly Chart Book – 6/17/16
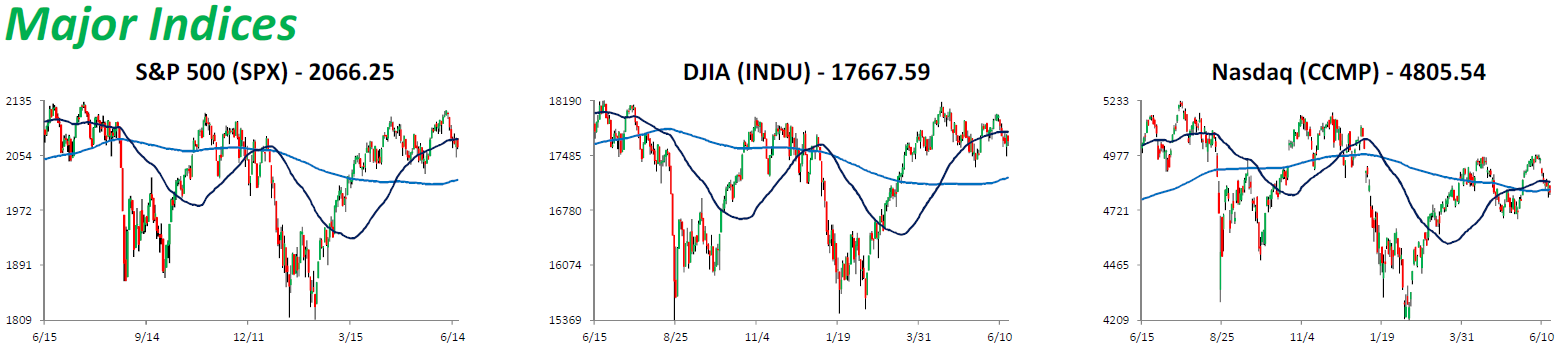
It wasn’t a very good week for stocks, as outside of an afternoon rally on Thursday, the market just couldn’t get into a positive rhythm. At the end of the week, the S&P 500, DJIA, and Nasdaq all succumbed to their 50-day moving averages. For updated charts of all the stocks in the S&P 500, check out our S&P 500 Weekly Chart Book.
Bespoke provides Bespoke Premium and Bespoke Institutional members with its S&P 500 Weekly Chart Book, which contains one-year price and volume charts of every stock in the S&P 500 grouped by sector. Whether you have five minutes or an hour, if you follow the charts, there is no faster way to get a read on which areas of the market are working and which are not.
See Bespoke’s S&P 500 Weekly Chart Book by starting a no-obligation free trial to our premium research. Click here to sign up with just your name and email address.
Oil Bounces Hard Off of 50-Day Moving Average
After a steep pullback of 10% from $51+ down to $46, oil tested support at its 50-day moving average today and then bounced hard into the weekend. From the open to the close today, oil rallied nearly 5% to end the week above $48. You can see the bounce off of the 50-day in the six-month chart of oil below. Oil bulls will certainly take it!
If you’ve never had a chance to check out Bespoke’s premium stock market research, we’d urge you to do so by starting a 14-day no-obligation free trial today. If you sign up this weekend, you’ll see our just-published Bespoke Report newsletter at the top of the page!

Chart of the Day – Housing Starts and Building Permits Diverge
This morning’s data on Housing Starts and Building Permits was a bit of a mixed bag, with little in the way of big changes on a month to month basis. On a y/y basis, though, total starts bounced nearly 10% while permits continued their downward trend, falling over 10% relative to last year.

In today’s Chart of the Day sent to paid subscribers, we analyzed the trend in Building Permits to see what it tells us about the broader economy. To view the report, please start a 14-day free trial below.
Dynamic Upgrades/Downgrades: 6/17/16
Starts Beat, Permits Miss
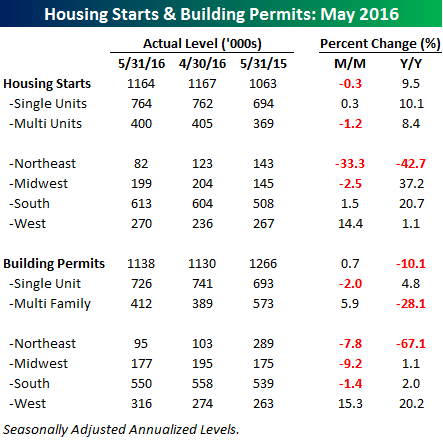
 Friday morning’s housing data was a mixed bag with Housing Starts exceeding consensus expectations by a slim margin and Building Permits missing estimates by an even slimmer one. With regards to starts, the seasonally adjusted annualized rate (SAAR) came in at 1.164 mln units compared to expectations of 1.150 mln and last month’s reading of 1.1167 mln units. For Building Permits, the SAAR rate came in at 1.138 mln units compared to expectations of 1.145 mln units and last month’s reading of 1.130 mln units. From their peaks last June, Housing Starts are down 4% while Building permits are down 14.7%.
The table below breaks down this month’s report by type of unit and region (charts of the overall national levels are provided below). As shown in the table, with regards to the size of units, May’s numbers for starts were pretty muted with little in the way of swings. Regarding Building Permits, though, multi-family units were strong with a m/m gain of 5.9% compared to a 2.0% decline in single-family permits. These have been volatile readings lately, though, as evidenced by the y/y readings where single-family are up 4.8% and multi-family are down 28.1%. On a regional basis, the West region was the strongest for both starts and permits with m/m increases of 14.4% and 15.3%, respectively. Meanwhile, activity in the Northeast looks to be down sharply, but those numbers are a bit misleading as readings from a year ago were unusually high due to the expiration of tax breaks last summer.
If you’ve never had a chance to check out Bespoke’s premium stock market research, we’d urge you to do so by starting a 14-day no-obligation free trial today. We’ll be sending out our weekly Bespoke Report this afternoon with a complete recap of the week.

The Closer 6/16/16 – “Analogous Action, Balanced Accounts, Price Pressure”
Looking for deeper insight on global markets and economics? In tonight’s Closer sent to Bespoke clients, we give our thoughts on the FOMC and the price reaction from markets. We also summarize two major economic releases from this morning.

The Closer is one of our most popular reports, and you can sign up for a trial below to see it and everything else Bespoke publishes free for the next two weeks!
Click here to start your no-obligation free Bespoke research trial now!
ETF Trends: Fixed Income, Currencies, and Commodities – 6/16/16
Below is our daily list of the twenty best and twenty worst performing ETFs over the last five trading days. Oil is suffering a full-fledged breakdown and oil funds lead the worst performers list along with crude-exposed Norway. European equities and short yen exposure (via DXJ) also got hammered. Yen has soared versus the dollar over the last 24 hours thanks to a BoJ on hold with regards to monetary stimulus. Long-term yields had a big reversal today intraday but have still delivered happy returns to bond investors over the last week.

Bespoke provides Bespoke Premium and Bespoke Institutional members with a daily ETF Trends report that highlights proprietary trend and timing scores for more than 200 widely followed ETFs across all asset classes. If you’re an ETF investor, this daily report is perfect. Sign up below to access today’s ETF Trends report.
See Bespoke’s full daily ETF Trends report by starting a no-obligation free trial to our premium research. Click here to sign up with just your name and email address.
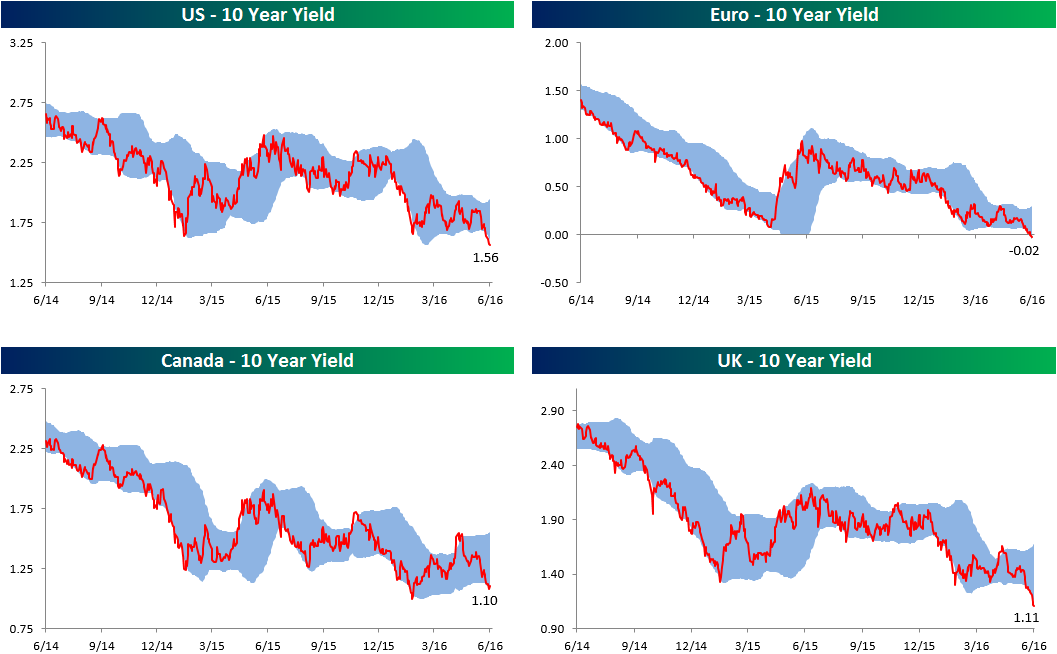
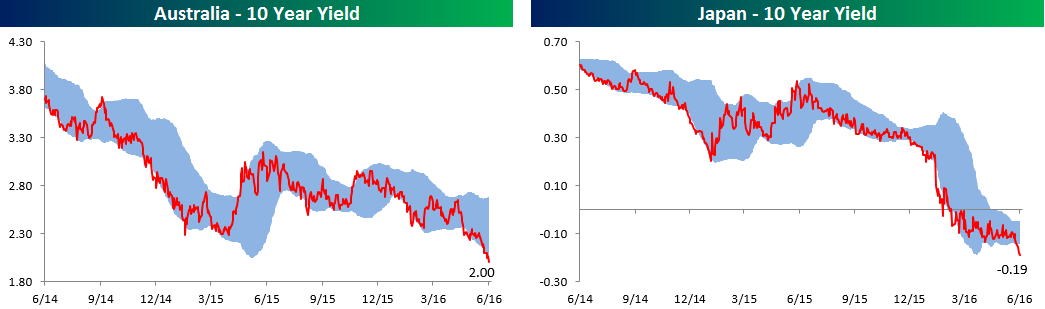
10-Years to Nowhere
Below we provide one-year trading range charts of 10-year sovereign debt yields for the US, Germany (Euro), Canada, the UK, Australia, and Japan. Notice a pattern? For Euro and Japanese debt, we had to adjust our axis and chart type to account for the move into negative territory. We definitely didn’t anticipate that when we created these charts nearly a decade ago!
If you’ve never had a chance to check out Bespoke’s premium stock market research, we’d urge you to do so by starting a 14-day no-obligation free trial today. We’ll be providing in-depth analysis of global fixed income markets plus much more in our weekly Bespoke Report newsletter that goes out to subscribers every Friday (tomorrow).