Bespoke’s Sector Snapshot — 6/23/16
We’ve just released our weekly Sector Snapshot report (see a sample here) for Bespoke Premium and Bespoke Institutional members. Please log-in here to view the report if you’re already a member. If you’re not yet a subscriber and would like to see the report, please start a 14-day trial to Bespoke Premium now.
Below is our trading range screen of the S&P 500 and its ten sectors. For each sector, the dot represents where it’s currently trading within its range, while the tail end represents where it was trading one week ago. Moves into the red zone are considered “overbought,” while moves into the green zone are considered “oversold.”
The black vertical “N” line in the screen represents each sector’s 50-day moving average. Solid gains today pushed the S&P and all ten of its sectors above their 50-day moving averages. That’s a healthy sign in our view.

Notably, even with the index trading slightly overbought from a price perspective, the S&P 500’s 10-day advance/decline line is slightly negative. That means underlying internals are far from overheated. This suggests that there’s still plenty of room to run on the upside if investors can just stay upbeat.
To see our full Sector Snapshot with additional commentary plus six pages of charts that include analysis of valuations, breadth, technicals, and relative strength, start a 14-day free trial to our Bespoke Premium package now. Here’s a breakdown of the products you’ll receive.

The Stock Market’s President
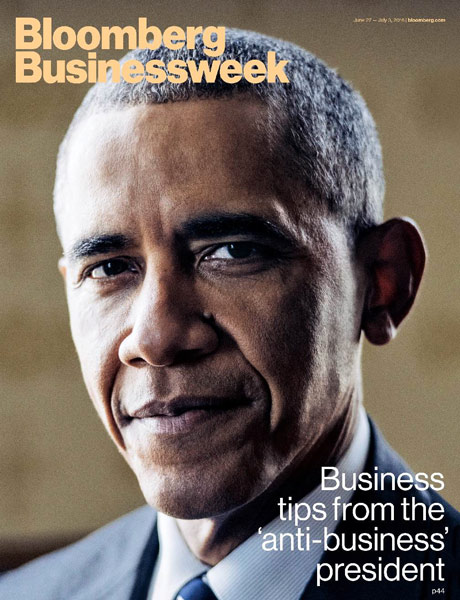 This week’s cover story on Bloomberg Businessweek contains a picture of President Obama with the caption, “Business tips from the ‘anti-business’ president.” Inside is a wide-ranging interview with the President on business and the economy. While the performance of the stock market is mentioned briefly in the opening, its last mention is word 72 of an approximately 5,000-word interview. While there are any number of reasons why equities are given a short shrift in the interview, it says a lot about the political/social mood today that President Obama would rather talk about other aspects of the economy than the stock market. True, there are plenty of other positives to highlight (fourth longest economic expansion since at least 1900, a record string of monthly job growth, new high in auto sales, etc), but for any other President in the last several decades, you can bet that if the stock market did well during their presidency, they would talk about it. But in an environment where an increasingly large percentage of Americans don’t trust, don’t care, or don’t have any money invested in the stock market, it has become a bit of a political hot potato.
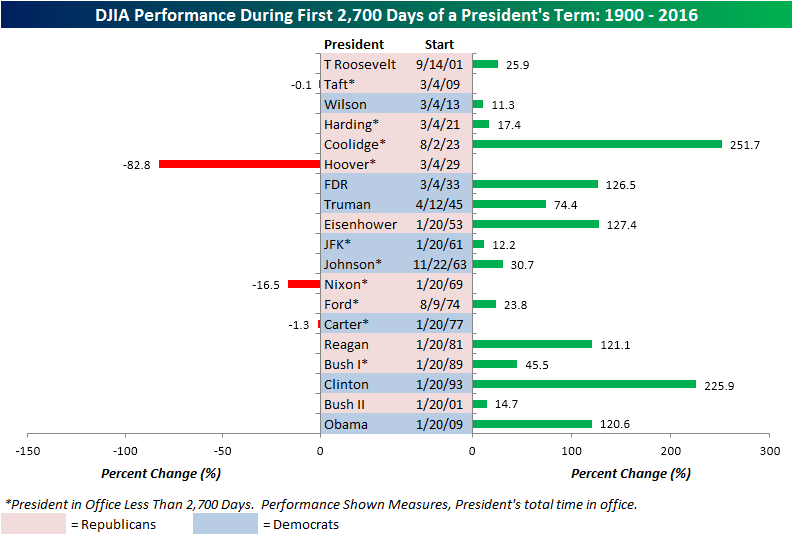
The reality, though, is that equities have done exceptionally well under the tenure of President Obama. Having been in office for just over 2,700 days now, the chart below compares the performance of the DJIA under President Obama’s tenure to the same duration for every other President since 1900. (If a President’s time in office was less than 2,700 days, we included their entire Presidency.) As shown in the chart, the DJIA’s performance of 120.6% during President Obama’s first 2,700 days ranks as the sixth best of any US President since 1900, just behind Reagan (+121.1%) and comfortably ahead of Truman, who at 74.4% is far behind. Looking at the way things stand, by the end of his entire tenure in office, President Obama could conceivably surpass Reagan and Eisenhower in terms of returns and finish in the top four for his entire time in office. While the DJIA was up 126.5% at this point in FDR’s Presidency, he had the benefit of four extra years in office and by the end of his tenure, the DJIA was up nearly 200%. President Obama can thank the 22nd Amendment for that!
GET FREE ACCESS TO ALL OF BESPOKE’S RESEARCH FOR 14 DAYS
(No Credit Card Necessary)
Chart of the Day: The Stock Market’s President
the Bespoke 50 — 6/23/16
Bullish and Bearish Sentiment Both Decline
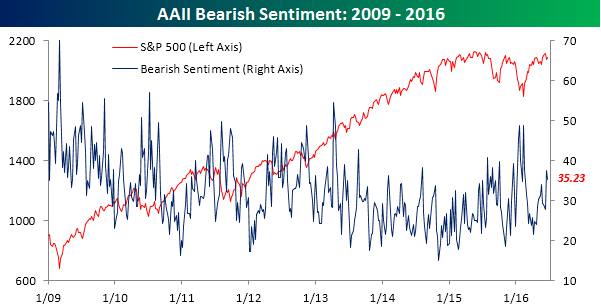
In yet another example of investors not knowing what to do in this market, the latest sentiment survey from the American Association of Individual Investors (AAII) showed that both bearish and bullish sentiment levels declined this week. It’s getting lonely in the bullish camp these days as just 21.97% of investors are positive on equities, which is down from 25.35% last week. This week’s reading now makes it 34 straight weeks that bullish sentiment has been below 40%. As mentioned, bearish sentiment also declined over the last week, but the decline was not as big (-2.27 percentage points). Furthermore, at 35.23%, more than one-third of investors are still bearish.
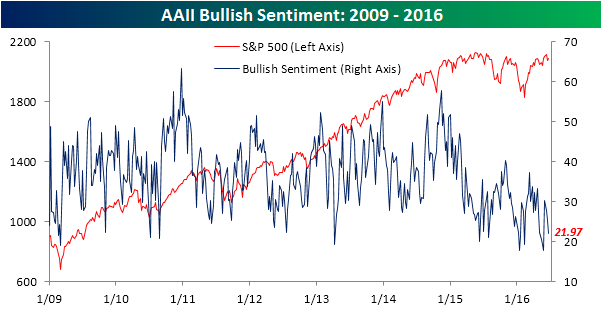
While bullish sentiment is stuck in the 20s and bearish sentiment in the 30s, neutral sentiment is back above 40%. As has been the case for well over a year now, when the S&P 500 nears 2,100, investors temper their enthusiasm for stocks.

2016 Election Odds Update
For the last couple of months, we’ve been updating Bespoke readers on 2016 election odds. Election outcomes always impact the way investors view various asset classes, but the potential outcomes for the 2016 election take things to another level. Our just released Q3 2016 Market Outlook includes an analysis on how various outcomes in the Presidential and Congressional elections have the potential to impact the market. Be sure to check it out!
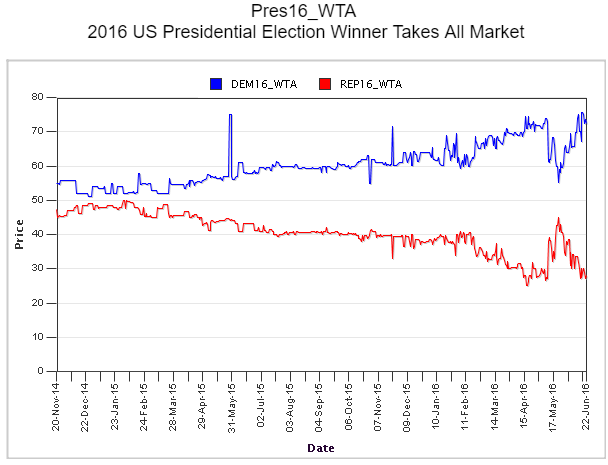
Below is a chart of the widely-followed Iowa Electronic Markets‘ contract for 2016’s Presidential winner. After tightening quite dramatically towards the end of May, the odds for the Democratic candidate to become President have recently spiked to new highs. They’re currently at 73% compared to 27% for the Republican candidate’s odds to win.
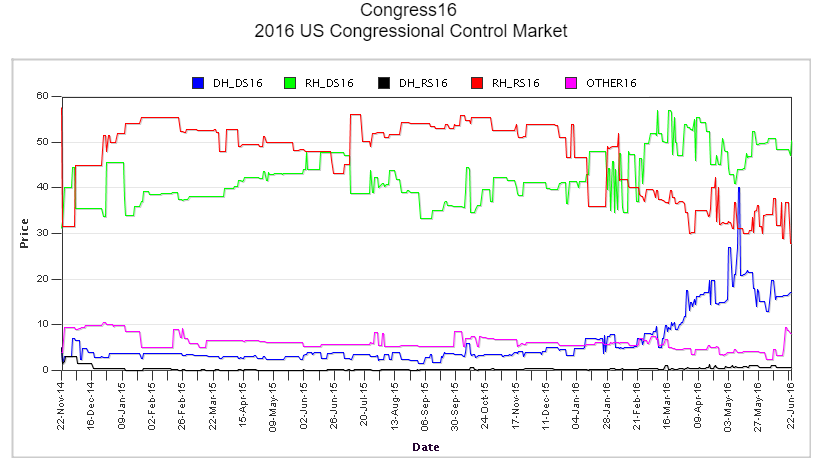
Republicans currently control both the Senate and the House, but as shown below, betting odds for the 2016 election currently favor a Senate controlled by the Democrats and the House controlled by Republicans (green line). While odds for a Dem Senate/GOP House are at 50%, the next closest odds are for Republicans to maintain control of both chambers.
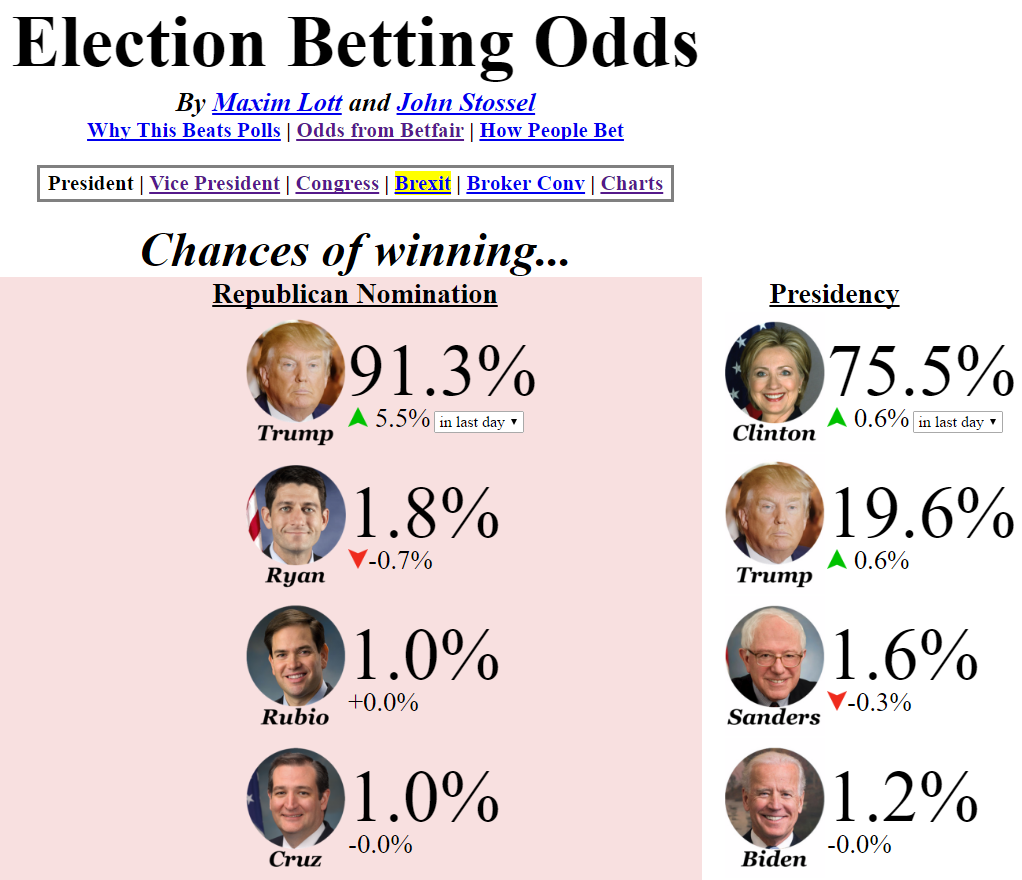
Along with the Iowa Electronic Markets, another site — electionbettingodds.com — maintains updated “chances of winning” numbers using Betfair.com spreads. As shown below, these odds currently project Hillary Clinton’s chances of becoming President at 75.5% compared to Donald Trump’s chances of just 19.6%.
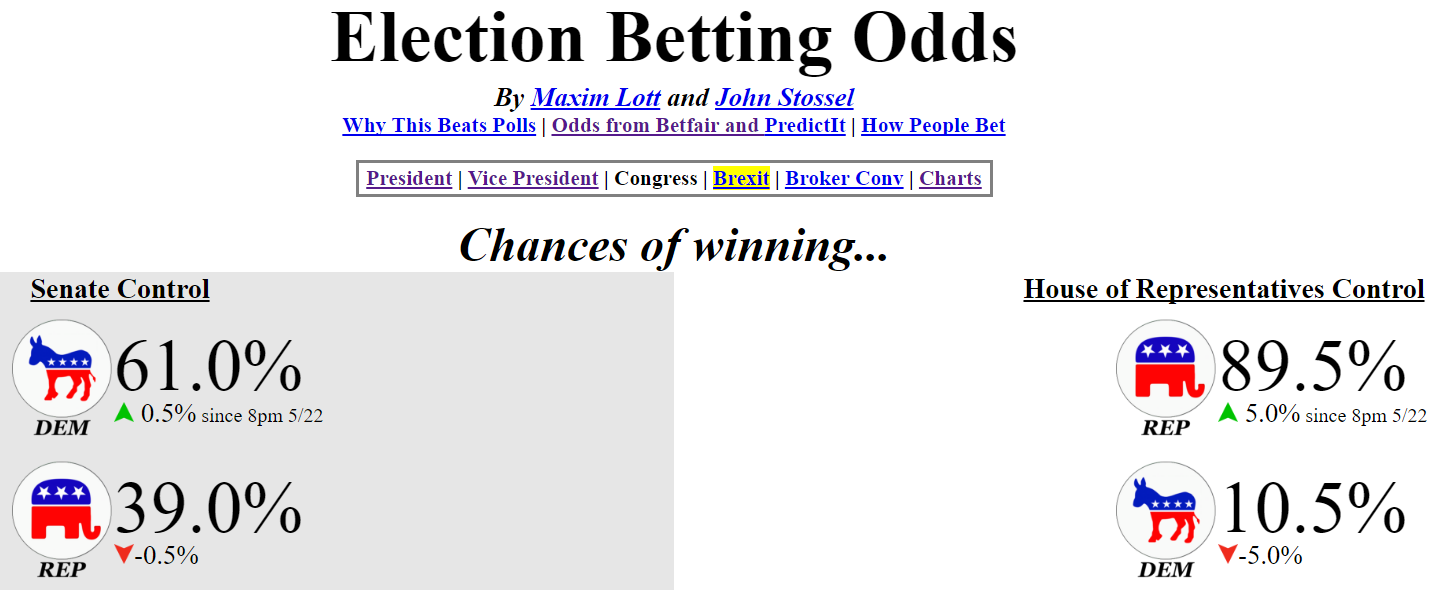
The electionbettingodds.com site also posts odds for Senate and House control. Odds for the Democrats to take back the Senate are currently at 61% compared to 39% for Republicans to maintain control. Republicans have odds of 89.5% to maintain control of the House.
GET FREE ACCESS TO ALL OF BESPOKE’S RESEARCH FOR 14 DAYS
(No Credit Card Necessary)
Claims Back Below 260K
The consistently low weekly prints for jobless claims never cease to amaze us. In the latest report this morning, first time claims dropped to 259K from last week’s level of 277K. It was also 11K below consensus expectations of 270K. It has now been 68 weeks since weekly claims were last above 300K. That is the longest streak since December 1973, and before that you have to go back to 1970. Keep in mind, though, that in the early 1970s the US population was much smaller than it is now, so on a population adjusted basis, the current streak is even more impressive.
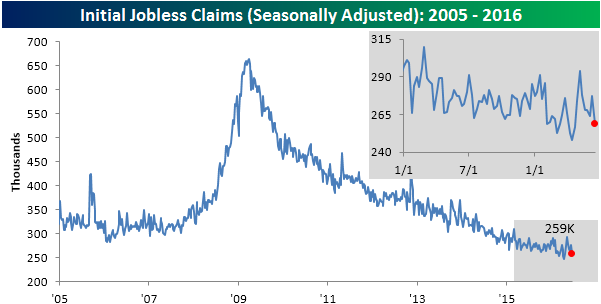
With this week’s decline, the four-week moving average has now dropped to 267K from 269.25K last week. It has now been nine weeks since claims made their cycle and multi-decade low of 256K, and while jobless claims have managed to surprise us time and time again, we expect that low to remain in place for some time.

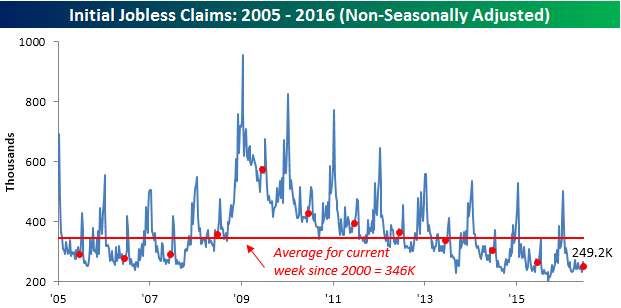
On a non-seasonally adjusted (NSA) basis, claims were just as impressive, coming in at 249.2K. For the current week of the year, that is 97K below the average since 2000, and the lowest level for the current week of the year since 1973.
The Closer 6/22/16 – “Housing Inventories Tight, Crude Inventories Loose”
Looking for deeper insight on global markets and economics? In tonight’s Closer sent to Bespoke clients, we recap the strong existing home sales print released this morning along with our weekly summary of EIA data on petroleum markets announced this morning.

The Closer is one of our most popular reports, and you can sign up for a trial below to see it and everything else Bespoke publishes free for the next two weeks!
Click here to start your no-obligation free Bespoke research trial now!
ETF Trends: International – 6/22/16
Below is our daily list of the twenty best and twenty worst performing ETFs over the last five trading days. As in prior days, region and country based exposures remained incredibly strong, dominating the list of top performers. These ETFs were primarily based in the Americas and Europe as well as emerging markets. Asian exposures were absent among the top performers and Hong Kong and India turned in anemic performances amidst the bottom twenty. Gold slipped even further as did the biotech stocks. US Treasury ETFs continued to fall as rates rise across the curve.

Bespoke provides Bespoke Premium and Bespoke Institutional members with a daily ETF Trends report that highlights proprietary trend and timing scores for more than 200 widely followed ETFs across all asset classes. If you’re an ETF investor, this daily report is perfect. Sign up below to access today’s ETF Trends report.
See Bespoke’s full daily ETF Trends report by starting a no-obligation free trial to our premium research. Click here to sign up with just your name and email address.
The Bespoke Report: Q3 2016 Market Outlook
Based on the popularity of our 2016 annual outlook piece, the Bespoke Report, we decided to provide additional quarterly updates throughout the year. Our Q3 Bespoke Report market outlook was published today. In this quarter’s report, we looked back at a Q2 in which a lot happened but very little changed, and we also look ahead to the rest of 2016. This report is for Bespoke members only and is available with any of our three membership levels. You can review all of our membership options and subscribe today to see the report immediately. Below is just one of the many charts in the report, but we thought we’d highlight that, historically, the third quarter has been the weakest for equity market returns. Read the report to find out if we think that is likely to be the case in Q3 2016 as well.
