ETF Trends: US Indices & Styles – 7/11/16
Homebuilders have been outperformers over the last week along with mining stocks, especially gold. That’s despite an extremely weak market for Energy commodities, which have plunged lower led by oil. Biotech, industrials, and mid-caps have also performed quite well while European national ETFs are lead lower by Italy on a week-over-week basis.

Bespoke provides Bespoke Premium and Bespoke Institutional members with a daily ETF Trends report that highlights proprietary trend and timing scores for more than 200 widely followed ETFs across all asset classes. If you’re an ETF investor, this daily report is perfect. Sign up below to access today’s ETF Trends report.
See Bespoke’s full daily ETF Trends report by starting a no-obligation free trial to our premium research. Click here to sign up with just your name and email address.
2nd Longest Bull Market in History
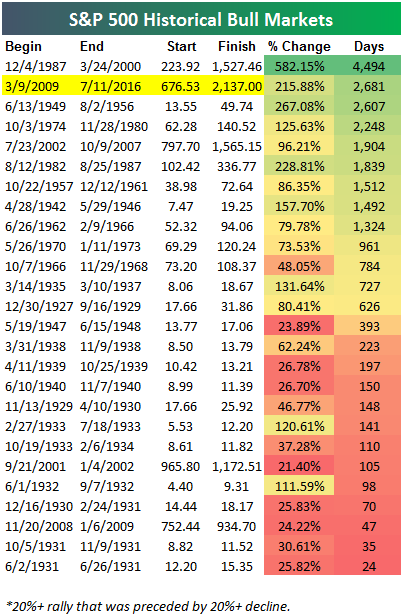
It’s official! With the S&P 500’s new all-time closing high today, the current bull market that began on March 9th, 2009 is now the second longest on record. But as shown in our chart of historical bull markets below, at 2,681 days, the current bull still has a long way to go to make it into first place. To eclipse the 4,494-day bull market that ran from 12/4/1987 to 3/24/2000, this bull would need to make it past June 28th, 2021 without experiencing a 20%+ decline from a closing high.
The current bull market that has now lasted 2,681 days has seen the S&P 500 rally 215.88%. While it is the second longest on record, it’s still just the 4th strongest on record. Find out how the market has historically performed when it has broken out of a bull-market pause of more than a year by starting a 14-day free trial to Bespoke’s premium research today!
Bespoke Stock Seasonality Report: 7/11/16
Chart of the Day: Intraday Buying Pattern?
B.I.G. Tips – Analysts Negative Once Again Heading Into Earnings Season
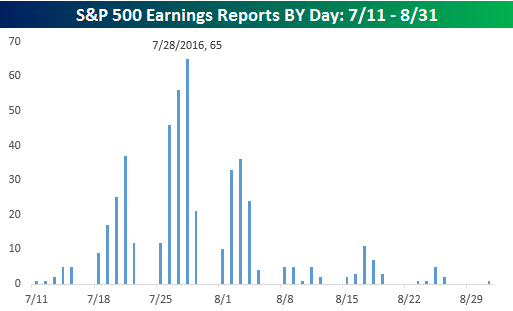 Earlier today, we posted a look at the number of companies set to report earnings by day during the upcoming earnings season, along with which stocks tend to exhibit the most volatility when they report earnings. The chart to the right shows a similar look at the pace of earnings for the upcoming reporting period but just includes S&P 500 names. Looking at how reports are spread out, the pace won’t really pick up until the middle of next week as you have to wait until 7/19 until more than ten S&P 500 companies report on the same day. The peak day for earnings among S&P 500 stocks is still 17 days away on 7/28 when 65 companies will report.
Earlier today, we also sent out a B.I.G. Tips report to Bespoke Premium and Bespoke Institutional members, which contained a preview of the upcoming earnings season and what we can expect based on analyst sentiment heading into the period. To get the full report, sign up.
See the full B.I.G. Tips report by signing up for a monthly Bespoke Premium membership now. Click this link for a 10% discount ($89/month).
The Most Volatile Stocks on Earnings — 7/11/16
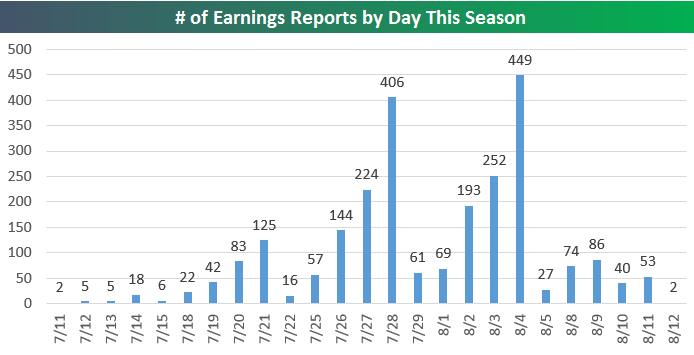
The Q2 2016 reporting period unofficially begins this evening with Alcoa (AA) set to report after the close. But even though earnings season starts this week, things don’t really pick up until late next week and beyond. A total of just 36 companies are set to report this week, but in early August more than ten times that many companies will report on one day (8/4) alone.
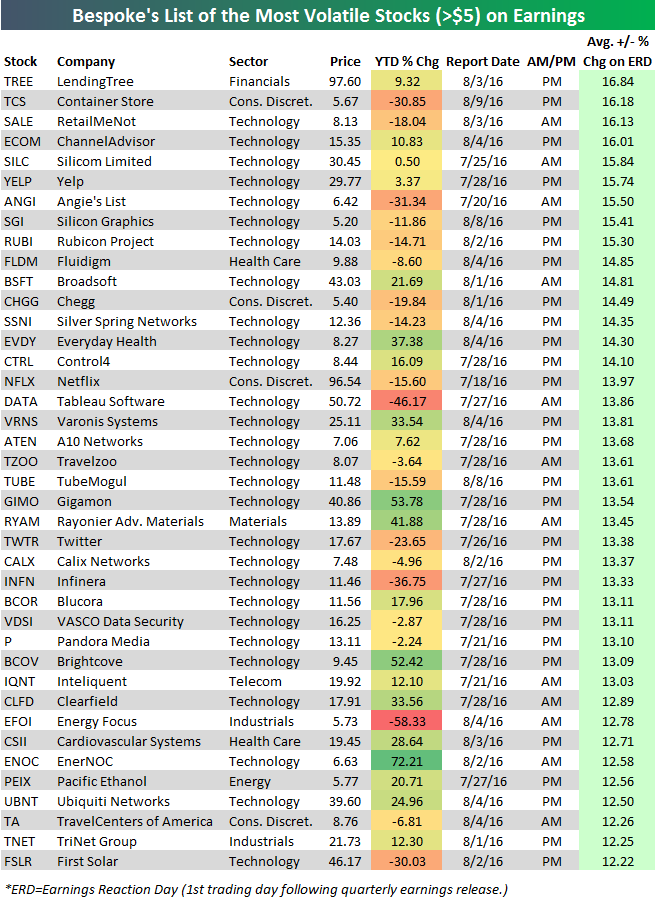
As we do at the start of each earnings season, below is our list of the most volatile stocks on earnings. Using our Interactive Earnings Report Database, the stocks below have all historically averaged a move of +/-12%+ on their historical earnings reaction days. For this screen, only stocks that trade above $5/share are included, and the stock must also have at least two years worth of quarterly earnings reports. Also, if you’re confused about what an “earnings reaction day” is, it’s the first trading day following a company’s earnings release. For a stock that reports before the open, its percentage change that trading day is its earnings reaction day. For a stock that reports after the close, its change the next trading day is its earnings reaction day.
Of the companies set to report earnings within the next month and a half, LendingTree (TREE) has historically been the most volatile, averaging a move of +/-16.84% on its earnings reaction days throughout its history as a public company. The Container Store (TCS), RetailMeNot (SALE), and ChannelAdvisor (ECOM) are not far behind, though, all with average moves of +/-16%+ on earnings. A few other notables on our list of the most volatile stocks on earnings include Yelp (YELP), Netflix (NFLX), Twitter (TWTR), Pandora (P), and First Solar (FSLR).
The table above includes all stocks currently trading above $5/share. If you’re looking for higher-priced stocks (in terms of $/share), below is a list of the most volatile stocks on earnings that trade for more than $50/share. LendingTree (TREE) is at the top of this list as well since it trades at $97.60, but Netflix (NFLX) ranks second, followed by Tableau Software (DATA), LinkedIn (LNKD), Elli Mae (ELLI), and Align Tech (ALGN). Other notables on this list include Priceline (PCLN), Intuitive Surgical (ISRG), TripAdvisor (TRIP), Michael Kors (KORS), Decker Outdoor (DECK), and Amazon.com (AMZN). For additional earnings-season analysis, start a 14-day free trial to Bespoke’s premium research today!

Dynamic Upgrades/Downgrades: 7/11/16
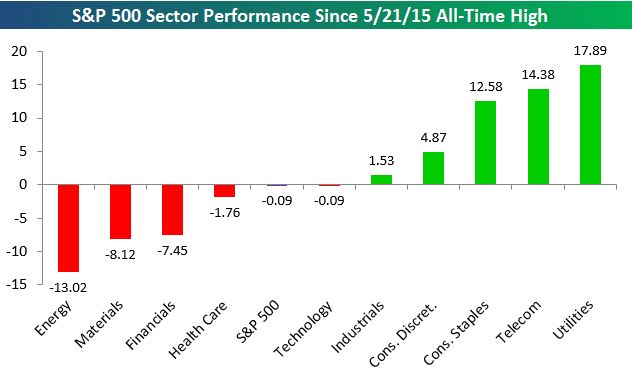
Sector Returns Since the Last S&P 500 Closing High
The S&P 500 is currently set to open above its May 21st, 2015 all-time closing high. Whether it actually closes at a new all-time high today is a different story, but we’re at least starting the day on a positive note. Below is a look at the performance of the ten S&P 500 sectors since the 5/21/15 all-time closing high. As shown, five sectors are down and five are up. The three defensive sectors — Utilities, Telecom, Consumer Staples — are all up double-digit percentage points. They’ve been by far the best performing areas of the market since last May’s high. The two cyclical sectors that are up over this time period are Industrials and Consumer Discretionary. The remaining five sectors have all been a burden on the broad index. Technology and Health Care are only slightly negative, while Financials, Materials and Energy are solidly in the red. The Energy sector is still down more than any other sector since the last all-time high for the market, but a few months ago things looked much, much, much worse! For actionable market analysis, start a 14-day free trial to Bespoke’s premium research today!
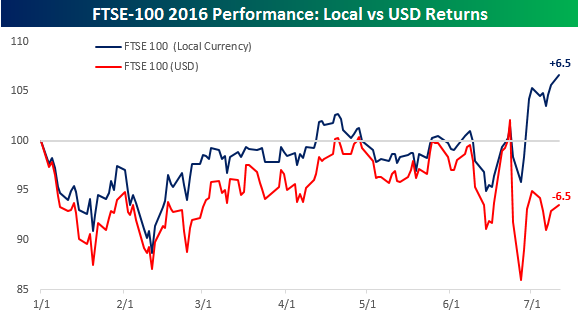
FTSE-100 Goes Both Ways
If anything definitive can be taken from Brexit, it’s that UK markets and the UK economy has been upended. A case in point is the performance of the benchmark FTSE-100. Leading up to the Brexit referendum on 6/23, whether you looked at returns in local currency or US dollars, the FTSE-100 was up marginally on the year with a gain of less than half of one percent. In the aftermath of the referendum, the FTSE-100 rallied in local currency terms as exporters with a large weighting in the index stood to benefit from the weak pound. In US dollar terms, however, stocks nosedived due to the collapse in the pound. Now, 13 days into the post-Brexit political and economic landscape, where do returns for the FTSE-100 stand? It depends on your perspective. In local currency terms, the FTSE-100 is up 6.5%, while in US dollar terms, it is down 6.5% You can’t get much more opposite than that!
GET FREE ACCESS TO ALL OF BESPOKE’S RESEARCH FOR 14 DAYS
(No Credit Card Necessary)
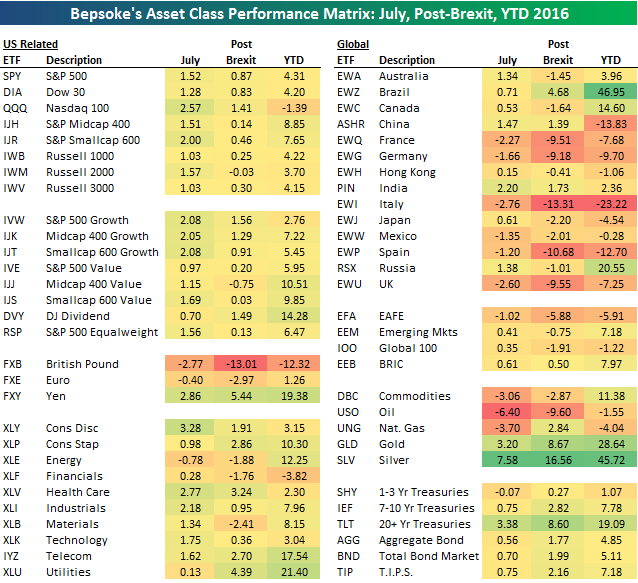
The BESPOKE REPORT — 7/8/16
Below is an updated look at our asset class performance matrix using key ETFs traded on US exchanges. For each ETF, we highlight its percentage change so far in the month of July, its change since the close prior to the Brexit vote on June 23rd, and its year-to-date change. Silver is certainly shining in 2016!
Each week, Bespoke sends clients across all of its subscription levels the Bespoke Report newsletter. If you’re looking for Bespoke’s analysis of current market internals, economic data, earnings beats and misses, individual stock ideas, and more, the Bespoke Report has it all.
Continue reading this week’s Bespoke Report by starting a 14-day free trial to our paid content below.
Have a great weekend!