B.I.G. Tips – S&P 500 Break-Out Chart
ETF Trends: Hedge – 7/12/16
Below is our daily list of the twenty best and twenty worst performing ETFs over the last five trading days. In a reversal of fate, a number of gold exposures switched from being among the top performers to being among the worst performers. Metals & Mining, as well as Steel Producers were the top two performing ETFs. Financial exposures performed strongly, and retail and homebuilding stocks continued to gain momentum. Long term treasuries and bonds performed poorly, and the Japanese yen saw the biggest drop over the last five days for the ETF universe we track.

Bespoke provides Bespoke Premium and Bespoke Institutional members with a daily ETF Trends report that highlights proprietary trend and timing scores for more than 200 widely followed ETFs across all asset classes. If you’re an ETF investor, this daily report is perfect. Sign up below to access today’s ETF Trends report.
See Bespoke’s full daily ETF Trends report by starting a no-obligation free trial to our premium research. Click here to sign up with just your name and email address.
Bespoke Stock Scores: 7/12/16
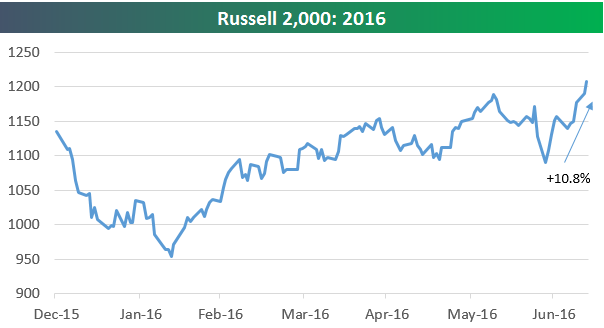
Chart of the Day: Russell 2,000 Up 10%+ Over the Last 10 Trading Days
The Russell 2,000 index of small cap companies has been on fire recently. In fact, the index is up more than 10% over the last 10 trading days! It hasn’t experienced that kind of move since December 2011. And it has only had 27 similar extreme moves higher over a 10-trading day period in its history going back to 1979.
In today’s Chart of the Day sent to paid subscribers, we take a look at how the Russell 2,000 has performed in the past when it has experienced similar moves of 10%+ over 10-trading day periods. To view the report, please start a 14-day free trial below.
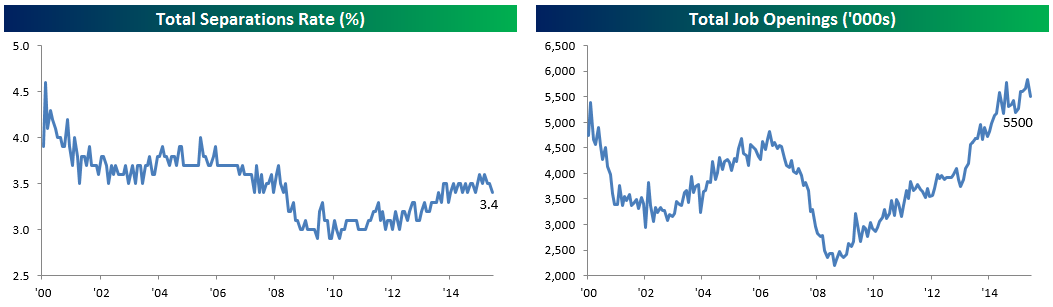
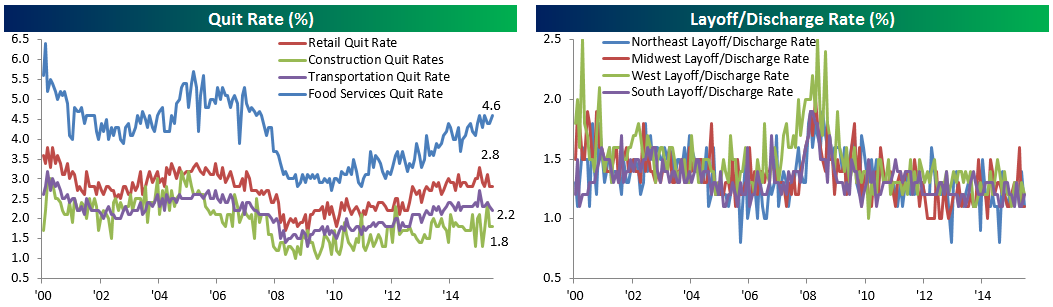
Openings Falter As Quits Soften and Layoffs Remain Rare
After hitting an all-time high last month, job openings dropped sharply MoM in May, to 5.5mm. Total separations (quits, firings, retirements, and all other forms of job departure) also slowed to 3.4%, from cycle highs hit earlier this year. Both indicate a slightly less tight labor market than would otherwise be the case, but it’s worth noting that the strong June payrolls figures suggest some seasonal issues between May and June in terms of adjustments to various figures.
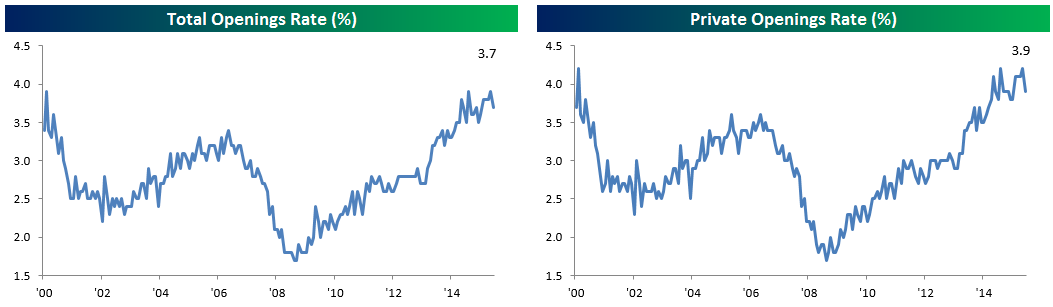
Along with the lower openings numbers, the openings rate dropped noticeably. Private openings were the source of the decline, with the government openings rate unchanged MoM at the second-highest level recorded since the data series starts in 2000.
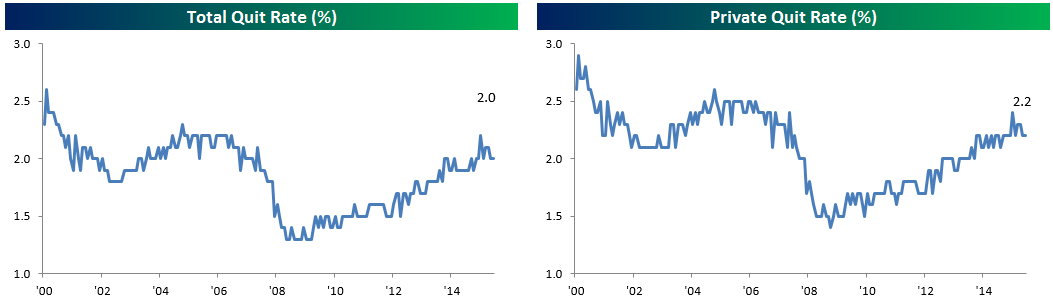
Quits for May showed further softening, though ongoing anecdotal evidence suggests businesses are having issues with talent retention (Starbucks raised prices and wages this week). Overall, the quits rate continues to trend gently higher but is at the lower end of its recent range as-of May.
While openings suggest a softening of labor demand, the JOLTS survey shows no evidence of cuts to existing labor forces. Layoffs and Discharges are both for all intents and purposes at the lows, and comfortably below recent minor upticks.

The low end of the labor market remains the place where the action is. Food Services has a quit rate at its highest level of the expansion, though retail store closures have held down the quit rate for that segment. Transportation is also seeing a rollover in its quit rate while Construction is volatile. On a regional basis, no particular area of the country saw an outlying print this month to skew layoff rates.
NFIB Exceeds Expectations
This morning’s report on optimism for small businesses improved for the third straight month in June, as the index of small business optimism from the NFIB increased from 93.8 up to 94.5 and exceeded consensus expectations of 93.9. June’s increase also represents the third straight monthly increase in the index, and while that may not sound like much, the last one was in the fourth quarter of 2014. That’s the good news. The bad news is that this month’s reading is still 1.5 points below the average reading of 96.0 dating back to 2000 and is still below where it closed out 2015. Additionally, as noted in the report from the NFIB, “…more owners still expect conditions to be worse than expect improvement.”

 The table to the right shows which issue business owners say is their number one problem. As is the case practically every month, Taxes and Govt Red Tape top the list at a combined 42%. Behind those two problems, business owners are increasingly citing Quality of Labor as a problem, while Poor Sales declined. Given the dollar’s recent strength and the plunge in interest rates post-Brexit, it shouldn’t be too much of a surprise to see that Inflation and Interest Rates are the two issues that have been cited the least by respondents at 2% each.
Seagate Spikes But Still Down
Shares of Seagate Technology (STX) are currently up over 19% versus yesterday’s close after the company raised sales guidance last night. STX has historically been volatile, but even for this stock a 19% one-day gain raises eyebrows. In fact, to find the last time the stock rallied more in a single day, you have to go back to 2/1/12 when the company reported strong Q4 results and raised guidance. Besides that day, the only other time in the last five years where STX saw a larger gain than today was on 10/21/11 when it also rallied in reaction to strong earnings. Perhaps even more notable than today’s rally in STX is the fact that the stock is still down 17% on the year. That’s because at one point in early May, it was down 47% YTD, so even after a rally of 57% off the lows, shares of STX still have some climbing to do before getting back in the black.

Biggest 10-Day Gain in Over Four Years
Financial markets sure have recovered following the two-day Brexit sell-off. After nice gains through Thursday, equities and risk assets went into overdrive following Friday’s Non-Farm Payrolls report. To put this move into perspective, including today’s trading, over the last ten trading days the S&P 500 has rallied over 7.5%. Throughout the current bull market, there have only been six other periods where equities have seen this sharp of a rally in such a short period of time with the last one occurring over four years ago in December 2011. This may be one of the most-hated bull markets on record, but it just broke out to new highs in style.

Bespoke Pulse Points — Brexit
If you’re reading this message, you currently do not have access to our Consumer Pulse add-on package. Sign up for a 30-day free trial here to see our Brexit survey analysis now.
The Closer 7/11/16 – “New Highs (In Stocks), New Lows (In Online Job Postings)”
Looking for deeper insight on global markets and economics? In tonight’s Closer sent to Bespoke clients, we take a look at what’s happened following previous new bull market highs like the record all-time high set today. We also take a look at the help wanted online indices produced by the Conference Board, and update our charts of futures market positioning from the CFTC, a preview of which is shown below.

The Closer is one of our most popular reports, and you can sign up for a trial below to see it and everything else Bespoke publishes free for the next two weeks!
Click here to start your no-obligation free Bespoke research trial now!