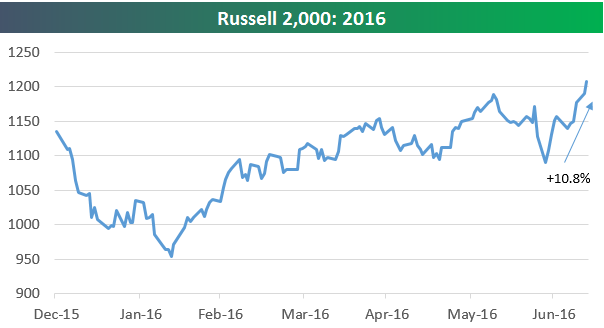
The Russell 2,000 index of small cap companies has been on fire recently. In fact, the index is up more than 10% over the last 10 trading days! It hasn’t experienced that kind of move since December 2011. And it has only had 27 similar extreme moves higher over a 10-trading day period in its history going back to 1979.
In today’s Chart of the Day sent to paid subscribers, we take a look at how the Russell 2,000 has performed in the past when it has experienced similar moves of 10%+ over 10-trading day periods. To view the report, please start a 14-day free trial below.
