The Closer 7/15/16 – End of Week Charts
Looking for deeper insight on global markets and economics? In tonight’s Closer sent to Bespoke clients, we recap weekly price action in major asset classes, update economic surprise index data for major economies, chart the weekly Commitment of Traders report from the CFTC, and provide our normal nightly update on ETF performance, volume and price movers, and the Bespoke Market Timing Model.

The Closer is one of our most popular reports, and you can sign up for a trial below to see it and everything else Bespoke publishes free for the next two weeks!
Click here to start your no-obligation free Bespoke research trial now!
The BESPOKE REPORT — 7/15/16
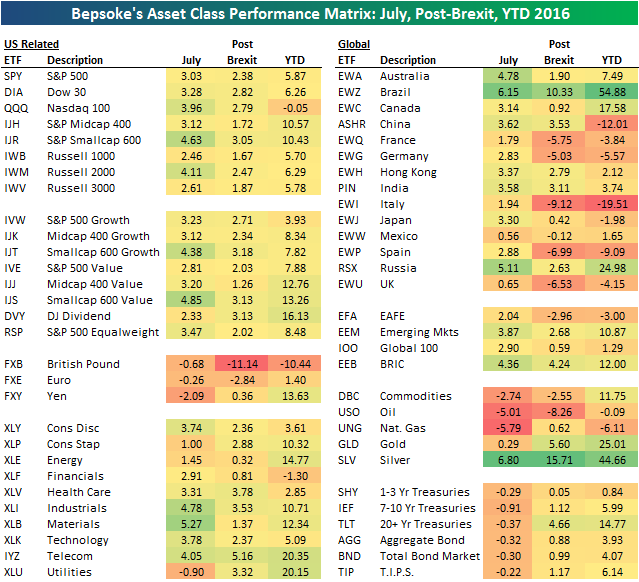
Below is an updated look at our asset class performance matrix using key ETFs traded on US exchanges. For each ETF, we highlight its percentage change so far in the month of July, its change since the close prior to the Brexit vote on June 23rd, and its year-to-date change. Industrials (XLI) and Materials (XLB) have been the top performing sectors in July, and both are now up more than 10% year-to-date. The Financial sector (XLF) is the only one still in the red for the year. Outside of the US, Brazil (EWZ) had another huge week with a gain of 6.15%. For the year, EWZ is now up 54.88%. That’s even better than Silver (SLV), which is now up 44.66%.
Each week, Bespoke sends clients across all of its subscription levels the Bespoke Report newsletter. If you’re looking for Bespoke’s analysis of current market internals, economic data, earnings beats and misses, individual stock ideas, and more, the Bespoke Report has it all.
Continue reading this week’s Bespoke Report by starting a 14-day free trial to our paid content below.
Have a great weekend!
ETF Trends: Fixed Income, Currencies, and Commodities – 7/15/16
Below is our daily list of the twenty best and twenty worst performing ETFs over the last five trading days. Steel Producers and Metals & Mining continued to inch up; JPY Hedged Japanese equity is the top performer on the week as the Nikkei has soared and the yen has fallen. More than half the top performers are regional exposures, a group that ranges from Austria to Taiwan. Financial stocks including Capital Markets, Broker Dealers, and Regional Banking also turned in strong performances on the week. Long term treasuries and bonds as well as gold and natural gas were the worst performers on the week although they were mostly unchanged as compared to yesterday.

Bespoke provides Bespoke Premium and Bespoke Institutional members with a daily ETF Trends report that highlights proprietary trend and timing scores for more than 200 widely followed ETFs across all asset classes. If you’re an ETF investor, this daily report is perfect. Sign up below to access today’s ETF Trends report.
See Bespoke’s full daily ETF Trends report by starting a no-obligation free trial to our premium research. Click here to sign up with just your name and email address.
S&P 500 Weekly Chart Book: 7/15/16
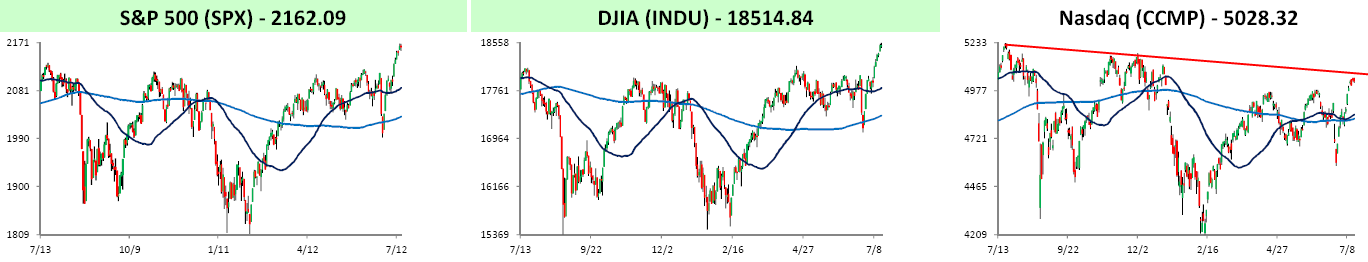
The S&P 500 spiked right above resistance and to new record highs this week, while the Dow Jones followed suit. The Nasdaq, meanwhile, still has some more climbing to do, not only yo make a new high, but to break its downtrend. Along with the S&P 500, four sectors also made new highs this week. In terms of individual stocks, there were a lot of new highs on the week, and you can check them all out in our S&P 500 Weekly Chart Book.
Bespoke provides Bespoke Premium and Bespoke Institutional members with its S&P 500 Weekly Chart Book, which contains one-year price and volume charts of every stock in the S&P 500 grouped by sector. Whether you have five minutes or an hour, if you follow the charts, there is no faster way to get a read on which areas of the market are working and which are not.
See Bespoke’s S&P 500 Weekly Chart Book by starting a no-obligation free trial to our premium research. Click here to sign up with just your name and email address.
50 Largest Stocks Reporting Earnings Next Week
Earnings season began with Alcoa’s (AA) report on Monday, but only a few dozen companies released numbers for the entire week. Next week is a different story, however, with hundreds of companies on the earnings calendar. Below is a list of the 50 largest companies set to report their quarterly numbers next week. For each company, we also include its historical earnings and sales beat rate taken from Bespoke’s Interactive Earnings Report Database, which you can learn more about here. The “earnings beat rate” is the percentage of the time the company has beaten consensus analyst earnings estimates over the last 15 years (unless the company IPOd more recently than that). The “sales beat rate” is the percentage of the time the company has beaten consensus analyst revenue estimates.
On Monday morning, Bank of America (BAC) and Charles Schwab (SCHW) release Q2 numbers. IBM, Netflix (NFLX), Yahoo! (YHOO) and VMware (VMW) all report Monday after the close. On Tuesday morning we hear from quite a few blue chips like Johnson & Johnson (JNJ), Philip Morris International (PM), UnitedHealth (UNH), Lockheed Martin (LMT) and Goldman Sachs (GS). Microsoft (MSFT) is the only big company reporting Tuesday after the close. Morgan Stanley (MS), Abbott Labs (ABT) and Halliburton (HAL) report Wednesday before the open, while Intel (INTC), Qualcomm (QCOM), American Express (AXP), Las Vegas Sands (LVS) and eBay (EBAY) report Wednesday after the close.
Thursday is the biggest day for earnings reports next week with 116 companies on the calendar. The biggest reports set for Thursday morning will be Biogen (BIIB), General Motors (GM) and Union Pacific (UNP). On Thursday after the close, we’ll hear from AT&T (T), Visa (V), Schlumberger (SLB) and Starbucks (SBUX). On Friday, General Electric (GE), Honeywell (HON) and VF Corp (VFC) will round out the week.
Of the companies shown below, VMware (VMW), Johnson & Johnson (JNJ), UnitedHealth (UNH), Lockheed Martin (LMT), Goldman Sachs (GS), Visa (V) and PayPal (PYPL) have the highest earnings beat rates — all above the 90% mark. VMware (VMW) also has one of the highest sales beat rates at 89%.
Start a 14-day free trial to Bespoke’s paid research to get more of Bespoke’s earnings season analysis, including our Interactive Earnings Season Calendar.
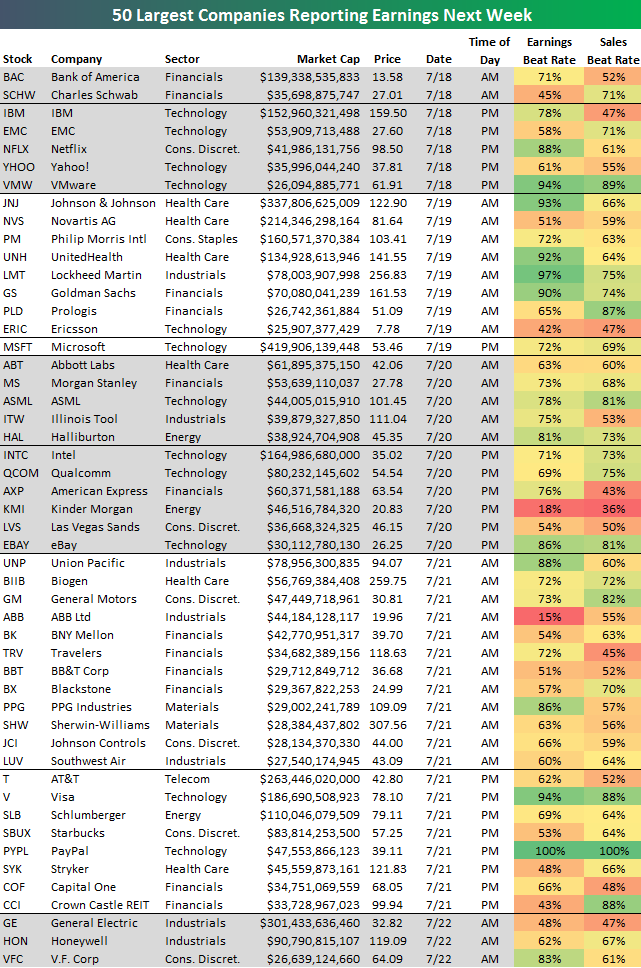
Chart of the Day – All Ten Sectors Overbought For the First Time Since March
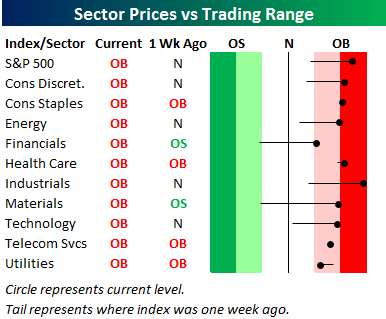 In Thursday’s Sector Snapshots report, we included the chart to the right showing that the S&P 500 and all ten sectors were trading at overbought levels (more than one standard deviation above 50-day moving average). As mentioned in the report, it’s not too common that you see all ten sectors rallying at the same time like they have in the last several days. The last time we saw a similar set up was earlier this year in March. With all ten sectors trading at overbought levels, it would make sense to expect some short-term consolidation as equities catch their breath and let their trading ranges catch up to them. This type of consolidation can either occur in the form of lower prices or time (sideways trading).
In today’s Chart of the Day sent to paid subscribers, we provided a list of 24 prior periods since 1990 where all ten sectors traded to overbought levels simultaneously after not having done so in the prior three months. Included is a summary of how the S&P 500’s performance over the following week, month, and quarter. To view it, please start a 14-day free trial below.
B.I.G. Tips – Another Beat In Retail Sales
Dynamic Upgrades/Downgrades: 7/15/16
The Closer 7/14/16 – Implied Correlation, Producer Prices
Looking for deeper insight on global markets and economics? In tonight’s Closer sent to Bespoke clients, we show the massive plunge in implied correlation for US equity indices, as well as a brief explanation of the metric. We provide forward returns for the S&P 500 under similar circumstances. We also take a look at today’s Producer Price Index report, which suggests modest PCE growth going forward thanks to weak health care services cost growth.
The Closer is one of our most popular reports, and you can sign up for a trial below to see it and everything else Bespoke publishes free for the next two weeks!
Click here to start your no-obligation free Bespoke research trial now!
ETF Trends: International – 7/14/16
Gold and Treasuries continue to outperform on a five day basis despite a painful selloff into the close of US equity markets for bonds today. We’ve seen large bounces in European equity markets over the last couple of days, but that hasn’t helped recoup most of the grim losses following the UK’s referendum vote last week. A sneaky strong performer has been natural gas with silver, TIPS, and other inflation proxies also doing quite well.
Bespoke provides Bespoke Premium and Bespoke Institutional members with a daily ETF Trends report that highlights proprietary trend and timing scores for more than 200 widely followed ETFs across all asset classes. If you’re an ETF investor, this daily report is perfect. Sign up below to access today’s ETF Trends report.
See Bespoke’s full daily ETF Trends report by starting a no-obligation free trial to our premium research. Click here to sign up with just your name and email address.