ETF Trends: US Sectors & Groups – 8/3/16
Below is our daily list of the twenty best and twenty worst performing ETFs over the last five trading days. Natural gas and the biotech exposures were both up on the day and the week. The gold stocks still had a strong 5-day performance, but were down slightly today. Japan JPY Hedged was the worst performer. Oil had its best day in a while, with some of the oil stocks jumping from the worst performer list to the best performer list. The Spanish and Italian ETFs turned in poor performances whereas Poland performed strongly, as EUR Hedged had a weak performance.

Bespoke provides Bespoke Premium and Bespoke Institutional members with a daily ETF Trends report that highlights proprietary trend and timing scores for more than 200 widely followed ETFs across all asset classes. If you’re an ETF investor, this daily report is perfect. Sign up below to access today’s ETF Trends report.
See Bespoke’s full daily ETF Trends report by starting a no-obligation free trial to our premium research. Click here to sign up with just your name and email address.
Chart of the Day: Biotech Rallies
The Nasdaq Biotech group experienced a pretty epic collapse after it made an all-time high in July 2015. From its high to its recent low this past June, the group fell 40%. Since June 27th, however, Biotech has surged, rallying 22.8% through trading earlier this morning. We just sent our paid subscribers our Chart of the Day analyzing Biotech’s recent action and how long this run higher could potentially last. To see the report, please start a 14-day free trial to Bespoke’s paid research below.

Crude Oil Inventories Rise More Than Expected
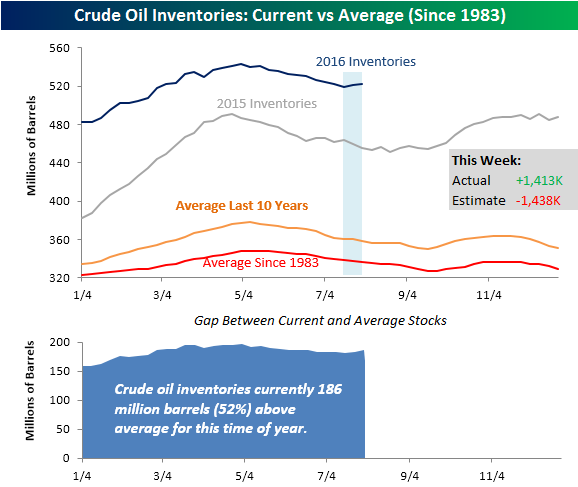
Crude oil inventories showed an unexpected build this week adding pressure to what has already been a tough couple of weeks for crude oil prices. According to the weekly survey from the Department of Energy (DoE), crude oil stockpiles increased by 1.413 million barrels compared to consensus expectations for a decline of 1.438 million. With this week’s increase, crude oil stockpiles are currently 186 million (52%) above their historical average for this time of year.
One of the big concerns for oil bulls has been the build in stockpiles that we have seen in the last two weeks. As shown in the top chart, the two-week increase in stockpiles that we have seen this week comes at a time when inventories are usually declining.
Services Sector Grows Less Than Expected
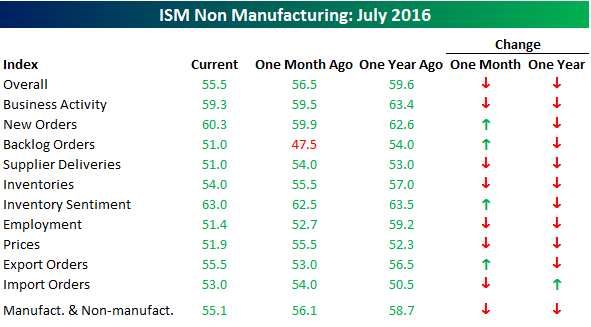
Today’s ISM Non Manufacturing report for the month of July showed solid growth, but less than what analysts were expecting. With a reading of 55.5, the headline index declined one point from last month’s level of 56.5 and was 0.4 points below consensus expectations (55.9). As shown in the top chart below, the ISM Non Manufacturing index has rebounded off its lows earlier this year, but is still well below its highs from late 2014 and early 2015. For the sake of comparison, the average monthly reading of the ISM Services index throughout the current economic expansion has been a reading of 54.7.
The second chart below shows the combined ISM reading for the month of July based on the weights of the manufacturing and non-manufacturing sectors in the overall economy. This month’s reading ticked down a point from 56.1 down to 55.1, which is a half point above the post-recession average of 54.6.

The table below breaks down this month’s report by each of its individual components. Breadth was generally negative in this month’s report with only four components increasing on a m/m basis and just one increasing (Import Orders) on a y/y basis. The biggest increases on a m/m basis were in Backlog Orders and Export Orders, while Prices Paid saw the largest decline. On a y/y basis, the Employment component saw the largest decline.
Dynamic Upgrades/Downgrades: 8/3/16
The Closer 8/2/16 – Saved By The…Revisions?
Looking for deeper insight on global markets and economics? In tonight’s Closer sent to Bespoke clients, we summarize revisions to the Personal Income and Spending estimates published monthly by the Bureau of Economic Analysis. We also preview a busy night of data releases ahead and a strong lineup of things to watch in the US tomorrow.

The Closer is one of our most popular reports, and you can sign up for a trial below to see it and everything else Bespoke publishes free for the next two weeks!
Click here to start your no-obligation free Bespoke research trial now!
ETF Trends: Hedge – 8/2/16
Below is our daily list of the twenty best and twenty worst performing ETFs over the last five trading days. It was the same story as yesterday, with the gold exposures outperforming the field and the oil stocks underperforming the field. In a similar vein, biotech was also up yet again. Natural gas and silver were also up. Health care providers and home construction both continued to drop as well.
Bespoke provides Bespoke Premium and Bespoke Institutional members with a daily ETF Trends report that highlights proprietary trend and timing scores for more than 200 widely followed ETFs across all asset classes. If you’re an ETF investor, this daily report is perfect. Sign up below to access today’s ETF Trends report.
See Bespoke’s full daily ETF Trends report by starting a no-obligation free trial to our premium research. Click here to sign up with just your name and email address.
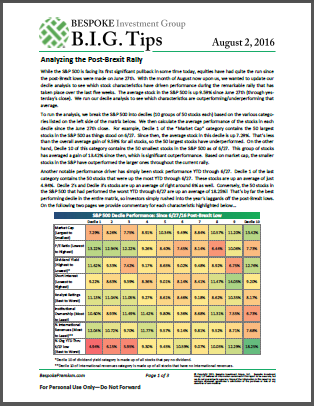
B.I.G. Tips – Post-Brexit Performance Drivers Using Our S&P 500 Decile Analysis
Earlier today, we sent Bespoke Premium and Bespoke Institutional members a brand new B.I.G. Tips report looking at the key stock characteristics driving performance since the S&P 500 made its post-Brexit low on June 27th. We looked at characteristics like market cap, dividend yield, valuations, short interest, analyst ratings, institutional ownership, and international revenue exposure. Each of these metrics can impact performance, and some of them have been much more impactful than others over the last five weeks. See the report now along with everything else we’ve published recently by signing up for a new premium research membership below.
See the full B.I.G. Tips report by signing up for a monthly Bespoke Premium membership now. Click this link for a 10% discount ($89/month).
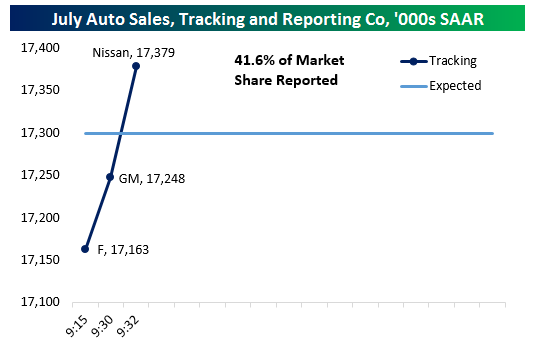
July Auto Sales Tracker — 3 Misses to Start
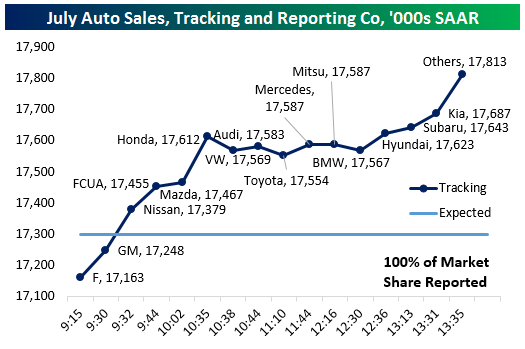
We’ve gotten July sales figures from Ford, GM, and Nissan, collectively about 41% of the US market for automobiles. So far, all three have missed individual estimates for their company’s sales, as rental fleet declines mask decent retail (consumer) unit growth for GM and Nissan. With those three reported, we’re tracking an auto sales figure of 17.379mm SAAR versus the 17.3mm SAAR expected by economists entering today’s reporting. Below we chart the evolution of that tracking, which is cumulative based on all reported companies as-of the most recent report. We’ll update this post further as more sales estimates roll in throughout the day.
Update 1 9:48 AM: Fiat-Chrysler announced a +0.3% YoY increase in sales (unadjusted for day count) and that has pushed our tracker up to 17.455mm SAAR. That’s still a decline versus the 17.505mm SAAR posted a year ago. We will continue to update the chart below as new sales figures are released.
Update 2 10:38 AM: Mazda and Honda both reported solid results, which took the SAAR estimate up slightly for Mazda and 0.25mm SAAR for Honda to a total run-rate of 17.7mm SAAR with 65% of the market reported. Toyota, Kia, and Hyundai are the last major manufacturers we are waiting on, though there are also a number of smaller players still pending.
Update 3 11:47 AM: With the addition of sales reports from Volkswagen and Toyota, we have updated our tracker to a 17.542mm SAAR reading versus 17.3mm expected. With 8 major manufacturers accounting for over 80% of the new car market reported, June sales for those reported are 1.219mm versus 1.227mm one year ago. Non-seasonally adjusted that’s a 66 bps decline versus July of 2015, but Federal Reserve seasonal adjustments are friendlier this month than they were in July 2015, when SAAR came in at 17.441mm. That’s why the current SAAR is up 58 bps YoY to 17.542mm in our tracker. We’ll provide one more update later today when minor manufacturers have reported.
Update 4 1:45 PM: With all auto OEMs now reported, NSA auto sales are up 40 bps versus July a year ago (see table at bottom). As we noted above, seasonal adjustment adds slightly to that total bringing auto sales to a 17.7mm unit SAAR by our estimate. We’ll hopefully hear from Ward’s Auto by the end of the day to confirm the SAAR estimate we’re tracking. As of now, however, it looks like a pretty solid month for auto sales versus the 16.61mm SAAR posted in June.
Final Update 3:47 PM: Wards Auto has announced SAAR of 17.8mm on their tracker, which we agree with as per the tracker below. We’ll be back next month with our running intraday tracker of auto sales for the month of August.
Is The Apple Watch Becoming Cool?
Our most recent edition of the monthly Bespoke Consumer Pulse report was published and sent out to clients on Friday. Each month, this report contains loads of actionable and useful data regarding the overall economy, consumer trends, and investor sentiment. Yesterday, we discussed investor sentiment from a macro perspective, so today we wanted to shift the focus to a more micro level, namely the Apple Watch.
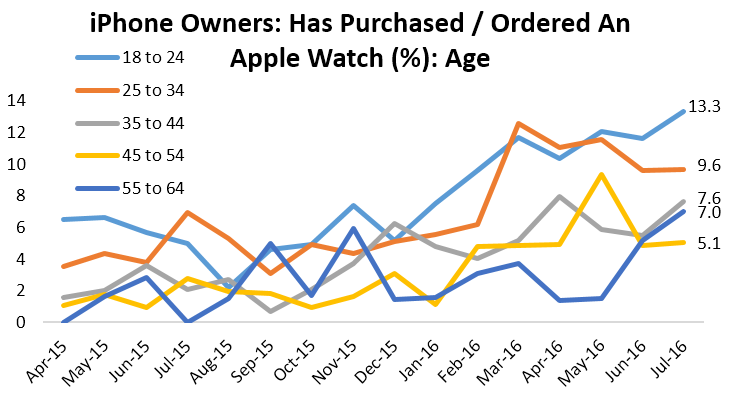
Has the Apple Watch finally become cool? Since its release last year, sales of the Apple Watch have been fairly disappointing, with cynics calling it, among other things, dorky and lacking style. However, our latest proprietary survey shows a steady m/m increase in the percentage of iPhone owners who have purchased or ordered an Apple Watch. Notably, 13.3% of those we surveyed in the 18-24 age group reported having purchased or ordered an Apple Watch, the most of any age group surveyed. So while we have seen some issues concerning Facebook and younger consumers, the Apple Watch does not seem to be suffering from the same fate.
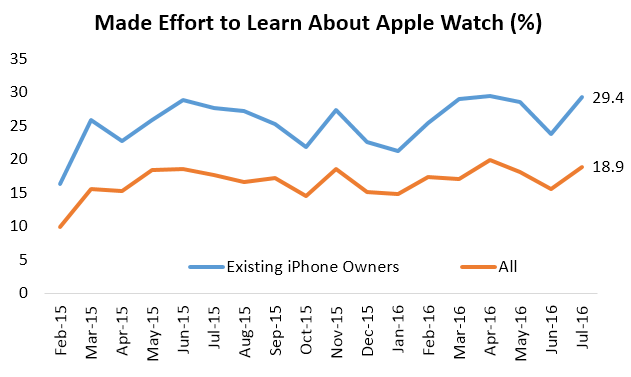
In another encouraging sign for the Apple Watch, our most recent survey showed that 29.4% of iPhone owners and 18.9% of all consumers had made an effort to learn about the Apple Watch, figures which have nearly doubled since the release of the product. The rate of iPhone owners aged 18-24 who made an effort to learn about the Apple Watch is at a series high, which bodes well for future purchases as well.
You can see our entire data-set of proprietary survey analysis with a 30-day free trial to our Consumer Pulse offering. We have said it before, but we’ll say it again: The value in the Bespoke Consumer Pulse offering is tremendous. We strongly encourage you to give our Consumer Pulse subscription a try!
Click here to learn more about the Consumer Pulse offering, or go ahead and start a 30-day free trial using one of the checkout links below.
Annual — Bespoke Consumer Pulse — $365/Year w/ 1-Month Free Trial
Monthly — Bespoke Consumer Pulse — $39.99/Month w/ 1-Month Free Trial