ETF Trends: Hedge – 8/16/16
Oil continues to rally aggressively along with most EM country-based ETFs. However, that rally isn’t universal as Indonesia has lagged badly. There’s also been a lot of pain in the yield-chase type sectors: REITs, Mortgage REITs, MLPs, Real Estate, and Utilities are all among the worst performers along with long-term Treasury bonds and the USD. Developed markets have done quite well along with most of EM, and the Energy complex generally (including E&P companies) has also benefited from higher oil.

Bespoke provides Bespoke Premium and Bespoke Institutional members with a daily ETF Trends report that highlights proprietary trend and timing scores for more than 200 widely followed ETFs across all asset classes. If you’re an ETF investor, this daily report is perfect. Sign up below to access today’s ETF Trends report.
See Bespoke’s full daily ETF Trends report by starting a no-obligation free trial to our premium research. Click here to sign up with just your name and email address.
Bespoke Stock Scores: 8/16/16
Overbought World
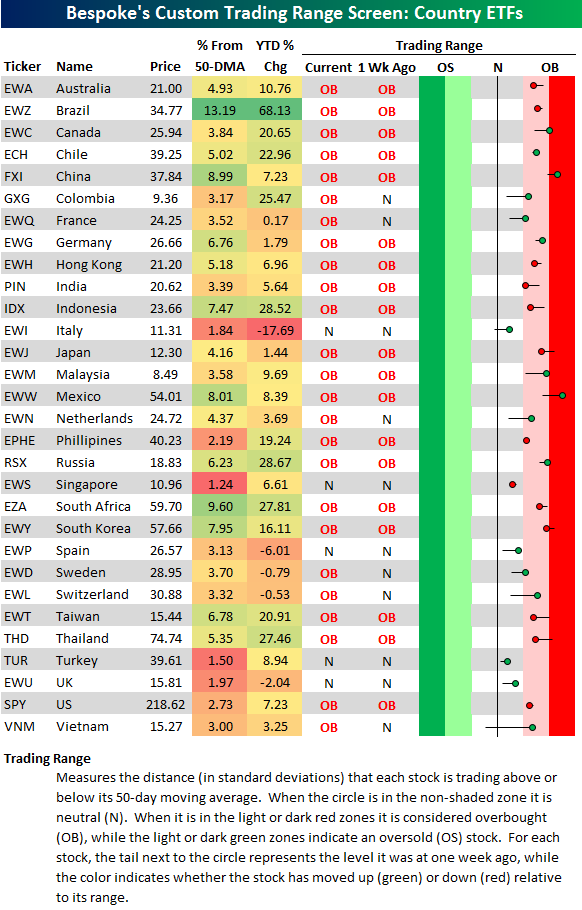
Below is our trading range screen for the 30 largest country ETFs traded on US exchanges. For each ETF, the dot is where the ETF is currently trading within its range, while the tail end represents where it was trading one week ago. The black vertical “N” line represents each ETF’s 50-day moving average, and moves into the red or green zones are considered overbought or oversold.
As you can see, 25 of the 30 country ETFs shown are currently in overbought territory, and all 30 countries are above their 50-day moving averages. That’s some serious upside momentum.
Starts Beat; Permits Still Weak
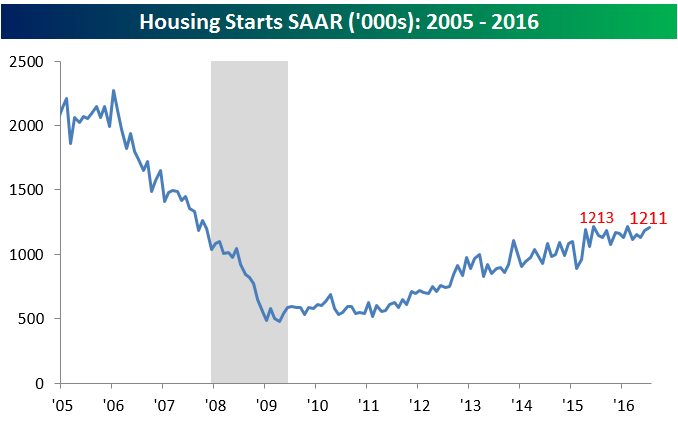
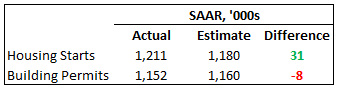 Housing Starts and Building Permits for the month of July were released earlier and showed mixed results relative to expectations. As shown to the right, Housing Starts came in at a level of 1.211 million SAAR units versus expectations for 1.18 million. Building Permits, however, were slightly weaker at a rate of 1.152 million versus estimates of 1.160 million units. As shown in the charts below, Starts are just 2K off their cycle high of 1.213 million units in June of 2015 and February of this year, while Permits are still trying to recover (unsuccessfully) from last summer’s tax-incentivised peak.

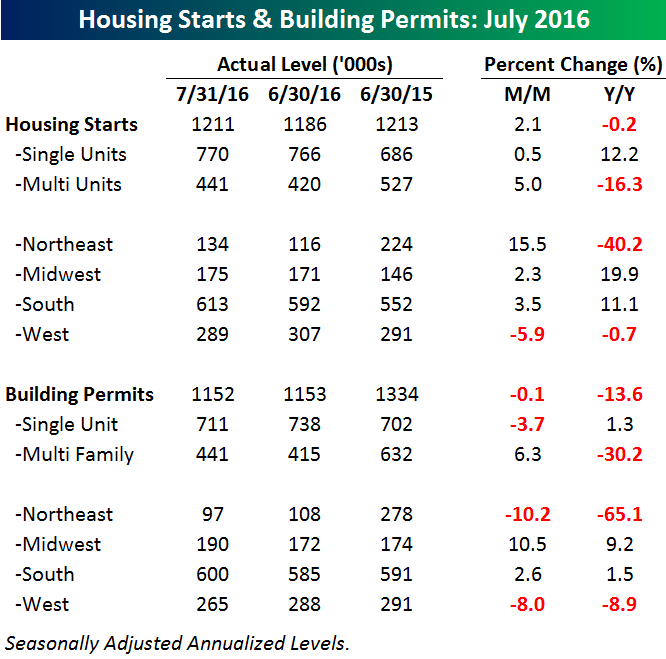
The table below breaks down this month’s report by region and type of unit. For both Starts and Permits, strength this month was in multi-family units which grew 5.0% and 6.3%, respectively. On a year/year basis, however, multi-family units are down big time, while single-family units are positive. Again, these big declines in multi-family units on a year/year basis are mostly the result of tax breaks for multi-family units in New York State that expired last summer. It is really clear in the y/y regional breakdown of both Starts and Permits — while every other region is up or down modestly, Starts in the Northeast are down 40.2% y/y and Permits are down 65.1%!
Finally, to smooth out the month to month moves in Starts and Permits, the chart below shows the rolling twelve-month average of the two series. It may be hard to see in the chart, but for the first time since March, both twelve-month averages increased on a month/month basis, and for Starts at least, barring a big drop in the months ahead, should keep trending higher.

The Closer 8/15/16 – Stapling Together Homes
Looking for deeper insight on global markets and economics? In tonight’s Closer sent to Bespoke clients, we spend some time talking about the valuation of Consumer Staples before diving into the NAHB’s Homebuilder Sentiment Index. We close with a summary of Treasury International Capital flows data on foreigner buying and selling of US securities.

The Closer is one of our most popular reports, and you can sign up for a trial below to see it and everything else Bespoke publishes free for the next two weeks!
Click here to start your no-obligation free Bespoke research trial now!
Chart of the Day (Part 2): China’s Shanghai Composite
B.I.G. Tips – The Bespoke Death By Amazon Indices Update 8/15/16
 Bespoke’s “Death By Amazon” index was created in 2014 as a way to track the performance of the companies most affected by the rise of Amazon.com (AMZN). Companies included must be direct retailers with a limited online presence (or core business based on physical retailing locations), a member of either the Retail industry of the S&P 1500 Index or a member of the S&P Retail Select Index, and rely on third party brands. We view these attributes as the best expression of Amazon’s threat to traditional retail. The index is designed as both a performance benchmark and idea generation tool for our clients. Indices are published monthly with market cap weightings and equal weightings.
Bespoke Premium and Bespoke Institutional clients have access to our monthly “Death by Amazon” report. If you would like to see this month’s just-published report, please sign up for a Bespoke Premium membership below!
See Bespoke’s full “Death by Amazon” index by signing up for a monthly Bespoke Premium membership now. Click this link for a 10% discount ($89/month).
Nasdaq 100 Stocks Farthest Above 50-DMAs
The tech-heavy Nasdaq 100 has now rallied 15% over the last 35 trading days since the post-Brexit low was made on June 27th. The type of “fear selling” that occurred during the 5% pullback we saw over two trading days post Brexit is what crushes long-term performance for many individual (and institutional) investors.
The average Nasdaq 100 stock is up 5% year-to-date, and the average stock is now 5% above its 50-day moving average as well. That’s a pretty extended reading that would suggest some kind of “mean reversion” trade — whether it’s through a pullback or sideways action — is on the horizon. The stocks below are the most extended in the index at the moment. These are the names currently trading the farthest above their 50-day moving averages. As shown, NVIDIA (NVDA) is the farthest above its 50-day at a whopping 22.27%! Seagate (STX), Micron (MU), Biogen (BIIB), JD.com (JD), and eBay (EBAY) are the next five most extended, and a few other notables on the list include Yahoo! (YHOO), QUALCOMM (QCOM), Apple (AAPL), Microsoft (MSFT), Amgen (AMGN), and Alphabet (GOOGL).

ETF Trends: US Indices & Styles – 8/15/16
Oil continues to rip higher as East Asian markets also catch a serious bid, led by China. With higher oil, Norway and Lat Am have gotten some support but European equities in general have done well as EURUSD moves gently higher. On the red side of the equation natural gas is in the most pain. Metals and mining have also underperformed dramatically despite the bid in the Energy complex. The same is true for MLPs which are down over 1.4% despite solid performance from spot commodities over the last week or so.
Bespoke provides Bespoke Premium and Bespoke Institutional members with a daily ETF Trends report that highlights proprietary trend and timing scores for more than 200 widely followed ETFs across all asset classes. If you’re an ETF investor, this daily report is perfect. Sign up below to access today’s ETF Trends report.
See Bespoke’s full daily ETF Trends report by starting a no-obligation free trial to our premium research. Click here to sign up with just your name and email address.
Chart of the Day: Biotech Rally
The Nasdaq Biotech Index has rallied 22% since its 2016 low on June 27th. We just sent paid subscribers our Chart of the Day analyzing Biotech’s recent bounce and whether it can last. We also feature one stock we currently like in the group. To see the report, please start a 14-day free trial to Bespoke’s paid research below.
