Preferred ETF Testing 50-DMA
Since a big collapse in early February as oil prices were making their 2016 lows, the preferred stock ETF — PGX — has made a nice run higher within a relatively tight uptrend channel. As shown below, the ETF has recently pulled back to its 50-day moving average, which is also the bottom of its tight uptrend channel. Technical longs will be looking for prices to hold and then bounce from here.
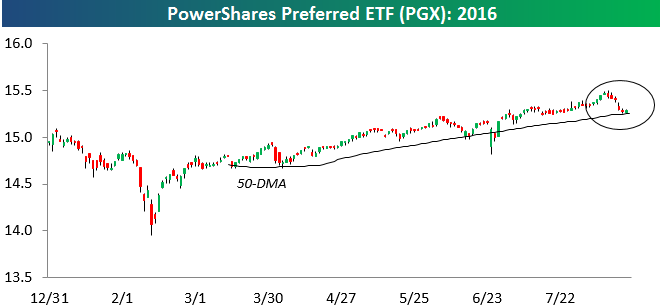
Chart of the Day: Bulls, Bears and Presidents
Fixed Income Weekly – 8/17/16
Searching for ways to better understand the fixed income space or looking for actionable ideals in this asset class? Bespoke’s Fixed Income Weekly provides an update on rates and credit every Wednesday. We start off with a fresh piece of analysis driven by what’s in the headlines or driving the market in a given week. We then provide charts of how US Treasury futures and rates are trading, before moving on to a summary of recent fixed income ETF performance, short-term interest rates including money market funds, and a trade idea. We summarize changes and recent developments for a variety of yield curves (UST, bund, Eurodollar, US breakeven inflation and Bespoke’s Global Yield Curve) before finishing with a review of recent UST yield curve changes, spread changes for major credit products and international bonds, and 1 year return profiles for a cross section of the fixed income world.
This week, we discuss the technical picture for the USD, including a trade idea that takes advantage of the current setup.

Our Fixed Income Weekly helps investors stay on top of fixed income markets and gain new perspective on the developments in interest rates. You can sign up for a Bespoke research trial below to see this week’s report and everything else Bespoke publishes free for the next two weeks!
Click here to start your no-obligation free Bespoke research trial now!
ETF Trends: US Sectors & Groups – 8/17/16
Below is our daily list of the twenty best and twenty worst performing ETFs over the last five trading days. Gold miners have underperformed badly over the last week or so with GDX the worst performer in the ETFs we track. Oil has gone the other way with a massive double-digit rally for ETFs that track oil futures or Energy futures more generally. China has also done very well, with MCHI, GXC, and FXI among the top performers. Retail has also surged despite weak reports over the last 24 hours from Lowe’s and Target. EM, duration, and low volatility stocks have all delivered painful downside over the last week.

Bespoke provides Bespoke Premium and Bespoke Institutional members with a daily ETF Trends report that highlights proprietary trend and timing scores for more than 200 widely followed ETFs across all asset classes. If you’re an ETF investor, this daily report is perfect. Sign up below to access today’s ETF Trends report.
See Bespoke’s full daily ETF Trends report by starting a no-obligation free trial to our premium research. Click here to sign up with just your name and email address.
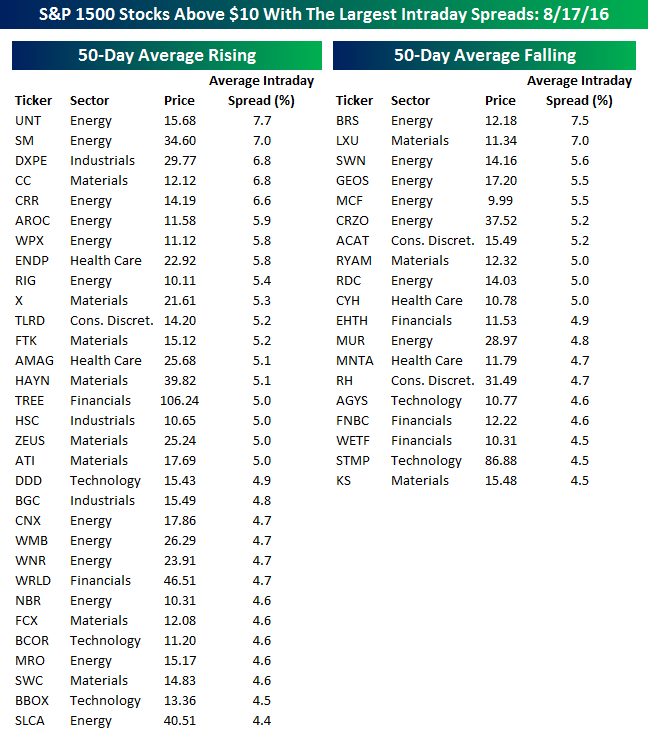
S&P 1500 Most Volatile Stocks: Summer Doldrums Edition
For traders with a short-term time horizon who are looking for big moves over a short period, we have updated our list of the S&P 1500 stocks trading above $10 that have the largest intraday high-low ranges (based on the average percent spread between the intraday high and low over the last 50 days). The stocks are grouped based on whether they have a rising or falling 50-day moving average (DMA).
Overall volatility in the equity market has really cratered this summer, and it shows in our periodic look at the most volatile individual stocks in the S&P 1500. While most stocks that make this list usually have an average daily range of at least 5% (and often 10%+), nearly half of the stocks on the current list (22 of 50) have average daily moves of less than 5%. The most volatile stock on the list is Unit Corp (UNT), which is from the Energy sector and has an average daily range of 7.7%. Along with UNT, 18 other stocks from the Energy sector make up the list, so despite the rebound in crude oil prices, Energy stocks remain volatile. One notable difference between now and earlier this year, however, is that the majority of Energy stocks shown are currently in short-term uptrends rather than downtrends.
Outside of the Energy sector, some of the more notable names on the current list of volatile stocks include US Steel (X), 3D Systems (DDD), and Restoration Hardware (RH). The highest priced stock on the list is Lendingtree (TREE). At a price of $106.24, the stock’s average daily move of 5% translates to an average intraday range of $5 between the stock’s daily intraday high and low.
Dynamic Upgrades/Downgrades: 8/17/16
The Closer 8/16/16 – Factories, Prices, and Houses
Looking for deeper insight on global markets and economics? In tonight’s Closer sent to Bespoke clients, we break down the three major US data releases of the day: industrial production, the consumer price index, and the monthly new residential construction report.
The Closer is one of our most popular reports, and you can sign up for a trial below to see it and everything else Bespoke publishes free for the next two weeks!
Click here to start your no-obligation free Bespoke research trial now!
US Dollar Index Approaching Bottom of Uptrend Channel
The US Dollar index had been trying to hold onto support at its 50-day moving average over the last couple of weeks, but today it fell hard below its 50-day. Since making a near-term low in early May, the Dollar Index has begun to form a new uptrend channel by making a series of higher highs and higher lows. As you can see below, today’s drop left the Dollar close to the bottom of this newly-formed uptrend channel, and those bullish on the currency will be watching closely to see if this support level can hold over the next few days.
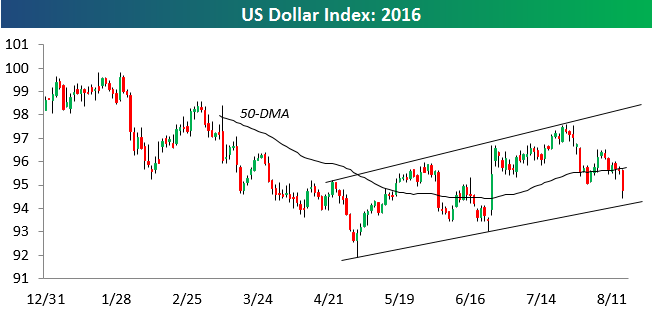
Chart of the Day: S&P 500 Up Through Mid-August
ETF Trends: Hedge – 8/16/16
Oil continues to rally aggressively along with most EM country-based ETFs. However, that rally isn’t universal as Indonesia has lagged badly. There’s also been a lot of pain in the yield-chase type sectors: REITs, Mortgage REITs, MLPs, Real Estate, and Utilities are all among the worst performers along with long-term Treasury bonds and the USD. Developed markets have done quite well along with most of EM, and the Energy complex generally (including E&P companies) has also benefited from higher oil.
Bespoke provides Bespoke Premium and Bespoke Institutional members with a daily ETF Trends report that highlights proprietary trend and timing scores for more than 200 widely followed ETFs across all asset classes. If you’re an ETF investor, this daily report is perfect. Sign up below to access today’s ETF Trends report.
See Bespoke’s full daily ETF Trends report by starting a no-obligation free trial to our premium research. Click here to sign up with just your name and email address.