Bespoke’s Sector Snapshot — 9/15/16
We’ve just released our weekly Sector Snapshot report (see a sample here) for Bespoke Premium and Bespoke Institutional members. Please log-in here to view the report if you’re already a member. If you’re not yet a subscriber and would like to see the report, please start a 14-day trial to Bespoke Premium now.
Below is one of the many charts included in this week’s Sector Snapshot, which is our trading range screen for the S&P 500 and its ten sectors. We discuss in more detail how to read the chart in the full version of the report, but basically the dot is where the sector is currently trading, while the tail end is where it was trading one week ago. As shown, even with today’s rally, the S&P 500 and eight of ten sectors are in oversold territory. The only sector that has held up well over the last week is Technology, and that has been driven by Apple’s (AAPL) post-iPhone 7 surge.
To see our full Sector Snapshot with additional commentary plus six pages of charts that include analysis of valuations, breadth, technicals, and relative strength, start a 14-day free trial to our Bespoke Premium package now. Here’s a breakdown of the products you’ll receive.
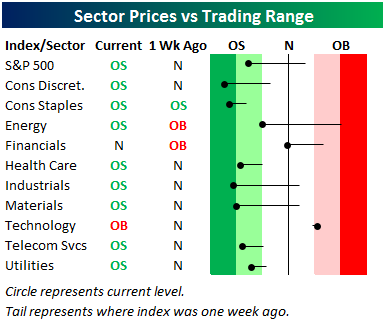
Chart of the Day – Lehman’s Failure: 8 Years Later
the Bespoke 50 — 9/15/16
Trump Over the Hump
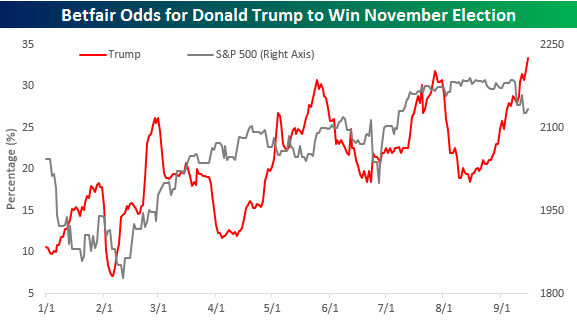
Earlier this week, we published a post discussing the recent trends in betting markets for the fall election and how Republican candidate Donald Trump was seeing quite a resurgence in his odds from the lows in early August. We also noted that every time Trump’s odds approached similar levels in the past, something would happen on the campaign trail, causing his odds to quickly revert back. In many ways, Trump’s odds of winning the election and the ‘resistance’ at around 30% was reminiscent of the S&P 500’s battle to break out above 2,100 in 2015 and early 2016. While stocks eventually broke through resistance, the question in the political markets on Monday was, could Trump get over the hump?
Since that post on Monday, Trump’s chances have continued to increase and as of this morning were at 33.7%, which is the highest level he has seen since he announced his candidacy. The odds for Trump to win in November are still only slightly better than one in three, and the betting markets haven’t always been the best predictors of actual political outcomes (Brexit vote), so Cher doesn’t have to pack her bags just yet, but the reversal of fortune in Trump’s candidacy still qualifies as a big turning point in the current election season.
B.I.G. Tips – Retail Sales Weak; Malls Get a Boost
ETF Trends: US Sectors & Groups – 9/15/16
For a second day, most ETFs we track were down versus a week ago. Short-term bonds, biotech, the USD index, and natural gas were the only ETFs that gained on the week. Commodity plays and Emerging Markets continued to underperform, along with gold miners.

Bespoke provides Bespoke Premium and Bespoke Institutional members with a daily ETF Trends report that highlights proprietary trend and timing scores for more than 200 widely followed ETFs across all asset classes. If you’re an ETF investor, this daily report is perfect. Sign up below to access today’s ETF Trends report.
See Bespoke’s full daily ETF Trends report by starting a no-obligation free trial to our premium research. Click here to sign up with just your name and email address.
Dow 30 YTD Performance and Trading Range Screen
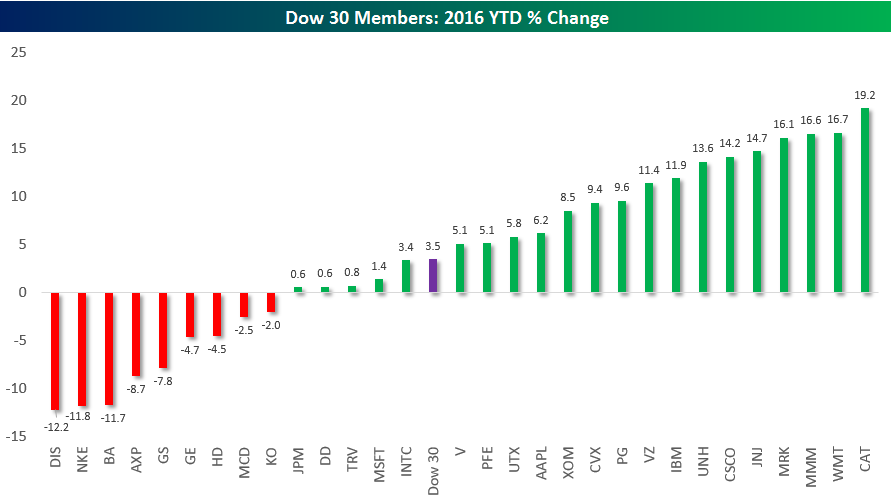
The Dow Jones Industrial Average began the trading day up 3.5% so far in 2016. Below is a look at the year-to-date performance of the Dow’s individual members. As shown, Caterpillar (CAT) leads the way with a gain of 19.2%, followed by Wal-Mart (WMT) at 16.7% and 3M (MMM) at 16.6%. Six other Dow stocks are up more than 10% YTD: MRK, JNJ, CSCO, UNH, IBM, and VZ. There are three Dow stocks down more than 10% YTD: Disney (DIS), Nike (NKE), and Boeing (BA). AXP, GS, GE, HD, MCD, and KO are the remaining Dow members in the red for the year. Most of these stocks have fairly horrible chart patterns at the moment.
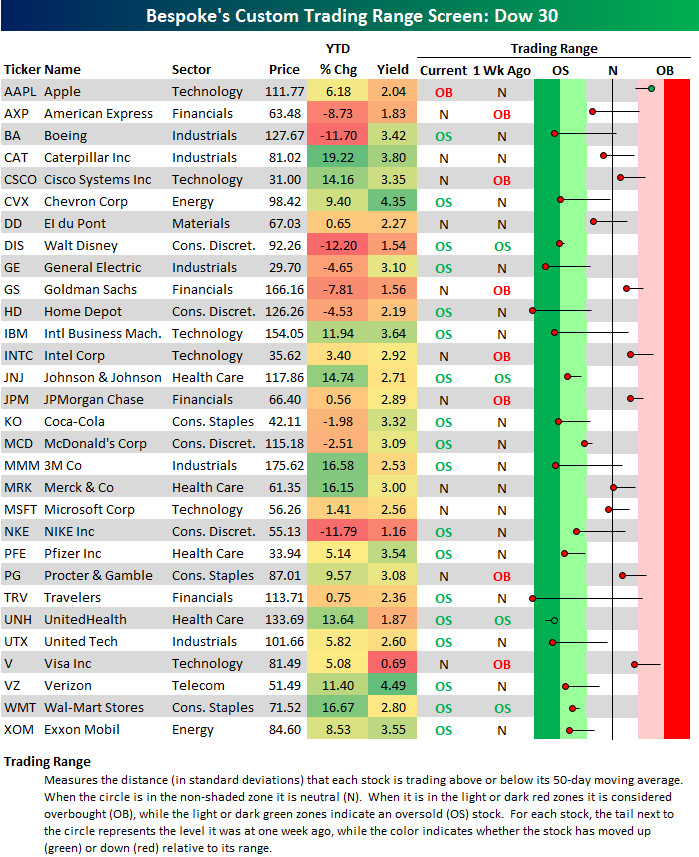
Below is a look at our custom trading range screen for the Dow 30 members. For each stock, the dot represents where it is currently trading within its range, while the tail end represents where it was trading one week ago. Hence, if the dot is to the right of the tail, the stock has moved higher within its range over the last week. If the dot is to the left of the tail, the stock has moved lower within its range over the last week. The black vertical “N” line in the screen represents each stock’s 50-day moving average. Moves into the red or green zone are considered overbought or oversold.
As you can see, the majority of stocks in the Dow are currently in oversold territory. In fact, eighteen of thirty stocks are oversold, while just one — Apple (AAPL) — is overbought. Given Apple’s downtrend over the last year, this is the first time the stock has been an outlier to the upside in quite a long time.
Stocks like Boeing (BA), General Electric (GE), Home Depot (HD), IBM, 3M (MMM), Travelers (TRV), and United Tech (UTX) have seen massive moves lower within their ranges over the last week. Just eight stocks in the index are above their 50-day moving averages, and all of them, except AAPL, have moved lower within their ranges over the last week.
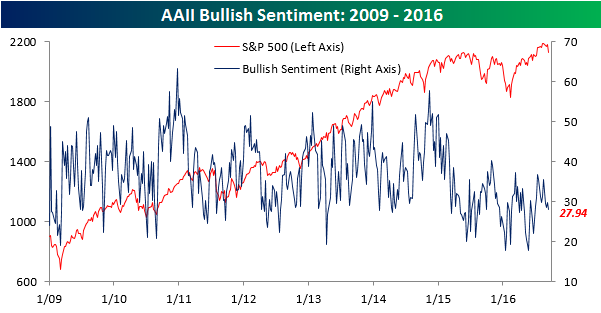
AAII Sentiment: A One Way Street
Investor sentiment these days is a bit of a puzzle. When the market goes down, bullish sentiment retreats while bearish sentiment spikes. However, when the market rises, bullish sentiment stays flat. This week’s sentiment survey from AAII is a perfect example. In the latest week, which includes the declines that began last Friday, bullish sentiment declined from 29.75% down to 27.94%. This represents the 46th straight week and the 80th time in the last 81 weeks that bullish sentiment has been below 40%.
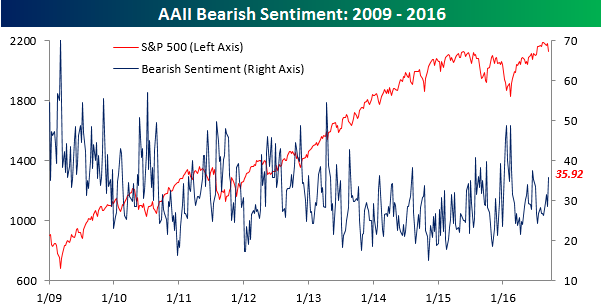
While bullish sentiment saw a relatively modest decline, bearish sentiment spiked, rising from 28.48% up to 35.92%. That seven percentage point increase was the largest since mid-June. As we often see following stock market declines like we have seen in the last week, there is still a widespread fear among individual investors of being left holding the bag when the music stops like they were back in 2000 and 2007, so at the first hint of trouble, sentiment shifts rapidly.
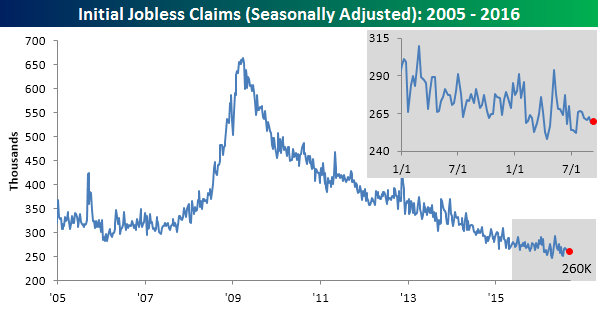
Jobless Claims: Old Reliable
On a day when the majority of economic data released was weaker than expected, like a loyal dog, jobless claims continue to hang in there. In the latest week, first time claims came in at a level of 260K, representing a 1K increase from the prior week. Relative to expectations, this week’s report was lower than the consensus expectation of 265K. That 265K consensus reading has been in place for nine of the last ten weeks, so it appears as though economists may still be out on summer vacation. As we have noted in most of our recent updates, jobless claims continue to defy the odds and remain depressed below 300K. This week’s print represents the 80th straight week that claims have been below 300K. You have to go all the way back to the early 1970s (when the US population was two-thirds the size of the current level) to find a time when claims were lower for longer.
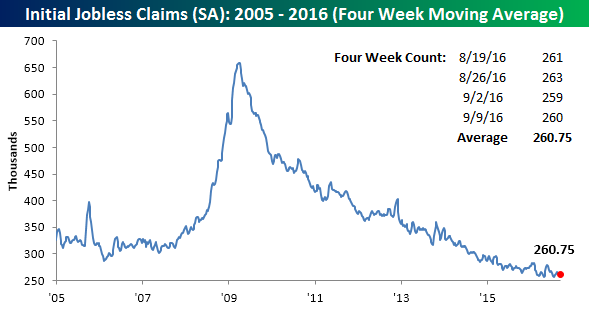
Even though this week’s print increased slightly, the four-week moving average saw a slight decline, falling from 261.25K down to 260.75K. That puts it within 5K of the cycle low of 256K that we saw 21 weeks ago back in April.
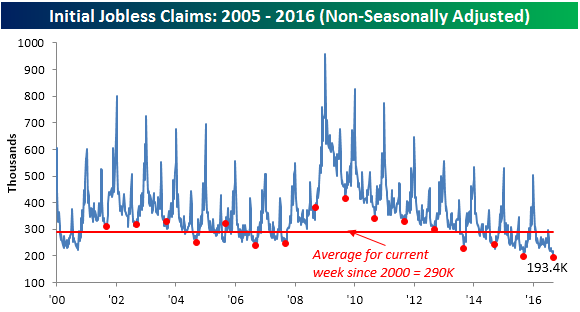
On a non-seasonally adjusted basis, this week’s jobless claims report was just as impressive. At a level of 193.4K, this week’s print was nearly 100K below the average level for the current week of the year dating back to 2000 and the lowest reading for the current week of the year dating all the way back to 1973.
The Closer 9/14/16 – Stocks Slink, Oil Slides
Looking for deeper insight on global markets and economics? In tonight’s Closer sent to Bespoke clients, we check up on global equities using our Global Index Screen. We also take a look at the petroleum market data released by the EIA today with three pages of charts and commentary.

The Closer is one of our most popular reports, and you can sign up for a trial below to see it and everything else Bespoke publishes free for the next two weeks!
Click here to start your no-obligation free Bespoke research trial now!