ETF Trends: Hedge – 10/12/16
Natural gas cares little for a surging USD (the third-best performing ETF we track over the past week) and neither does coffee or emerging countries in the Americas. Oil has also held up, along with steel. Biotech has gotten absolutely crushed in the last few days, possibly a market signal that Democrat Hilary Clinton is getting closer to a successful White House bid. Other EM names have underperformed badly along with gold miners and anything related to the UK.

Bespoke provides Bespoke Premium and Bespoke Institutional members with a daily ETF Trends report that highlights proprietary trend and timing scores for more than 200 widely followed ETFs across all asset classes. If you’re an ETF investor, this daily report is perfect. Sign up below to access today’s ETF Trends report.
See Bespoke’s full daily ETF Trends report by starting a no-obligation free trial to our premium research. Click here to sign up with just your name and email address.
Fixed Income Weekly – 10/12/16
Searching for ways to better understand the fixed income space or looking for actionable ideals in this asset class? Bespoke’s Fixed Income Weekly provides an update on rates and credit every Wednesday. We start off with a fresh piece of analysis driven by what’s in the headlines or driving the market in a given week. We then provide charts of how US Treasury futures and rates are trading, before moving on to a summary of recent fixed income ETF performance, short-term interest rates including money market funds, and a trade idea. We summarize changes and recent developments for a variety of yield curves (UST, bund, Eurodollar, US breakeven inflation and Bespoke’s Global Yield Curve) before finishing with a review of recent UST yield curve changes, spread changes for major credit products and international bonds, and 1 year return profiles for a cross section of the fixed income world.
This week, we look at the sector composition of some popular fixed income ETFs.

Our Fixed Income Weekly helps investors stay on top of fixed income markets and gain new perspective on the developments in interest rates. You can sign up for a Bespoke research trial below to see this week’s report and everything else Bespoke publishes free for the next two weeks!
Click here to start your no-obligation free Bespoke research trial now!
JOLTS Seasonality Sends Strange Signal
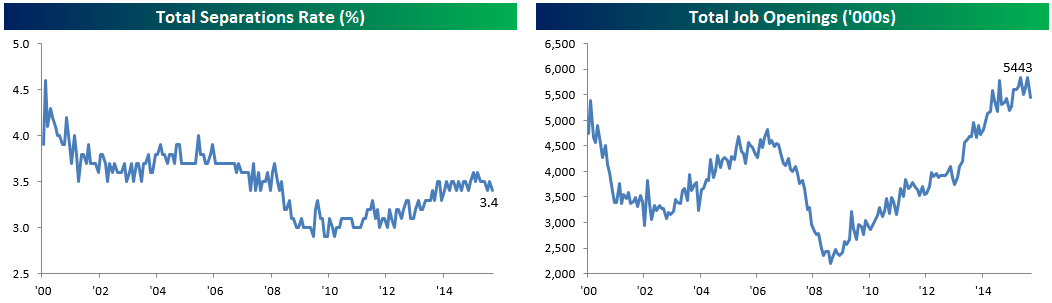
 Job openings in the US labor market unexpectedly plunged 388,000 in the month of August to a mutli-month low of 5.443 million versus expectations for a new all-time high of 5.8 million openings. The decline is the largest since August of last year and the widest miss versus expectations since at least July of 2011 when our data begins. We noted that last year, extremely strong July listings (+680,000 MoM) were followed by a similar August swoon when listings fell 480,000 sequentially. That got us curious. At right, we show the 2016 MoM change in openings by month, along with the average MoM change for that month over the last five years. As shown, there’s a clear seasonal pattern in the openings releases, with every month this year following the same directional pattern as the five year average. That’s despite seasonal adjustment by the Bureau of Labor Statistics. In that context, August is the weakest month of the year seasonally for this release, and lived up to its billing in 2016. With this seasonal pattern in mind, we don’t see this report as a turning point for the rise of openings. We’ll discuss some other evidence later in the post. As a final note, keep in mind that when openings decline by >100,000 MoM (since July 2011), subsequent revisions average +63,000, so this number is quite likely to be revised higher in coming releases.
Because the layoffs rate is near all-time lows, total separations are at a relatively low level. Quits are also low, helping push this number sideways for the last two years; again, more on that below.
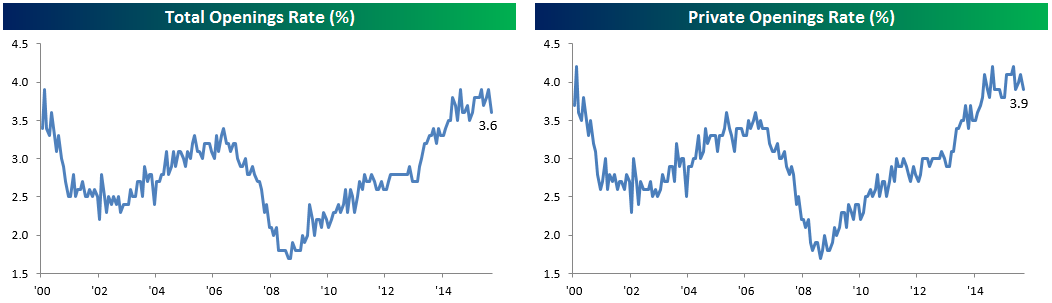
With the number of openings falling sharply, the openings rate plunged to 3.6%, down 0.3% sequentially. Private openings rates saw more modest declines, but are still moving largely sideways over the past two years.
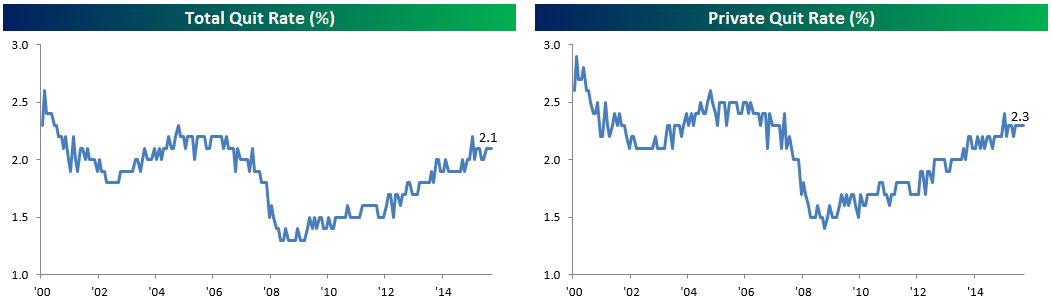
One reason we see this report as suspect due to seasonal adjustment is no decline in quit rates MoM; if employers were pulling back from the labor market in a significant way we would expect at the least a lower quit rate, but it was unchanged from July for both the total labor market and the private sector.
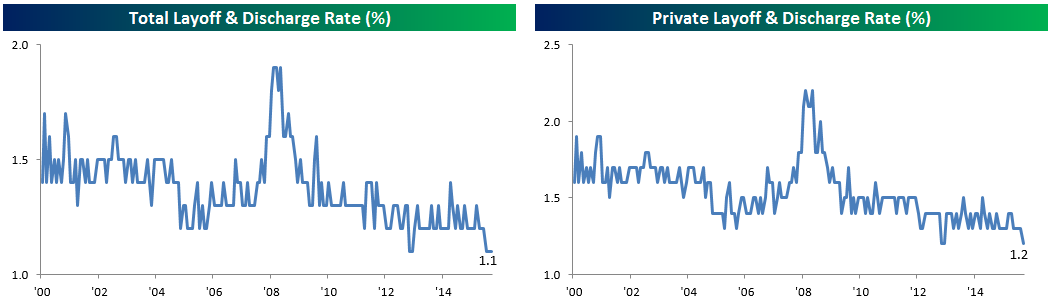
Layoffs also remain extremely low. While we wouldn’t necessarily expect a huge uptick given the numbers on the openings front, both total and private-only layoff/discharge rates are at the lowest levels in the history of the JOLTS survey.
A similar story is found at the industry and geographic level. None of the four key industries we keep an eye on for quit rates rose sequentially, and Construction quits actually ticked higher. Geographically, there was also a strong showing from layoff/discharge rates which are not consistent with falling labor demand that lower openings might indicate.
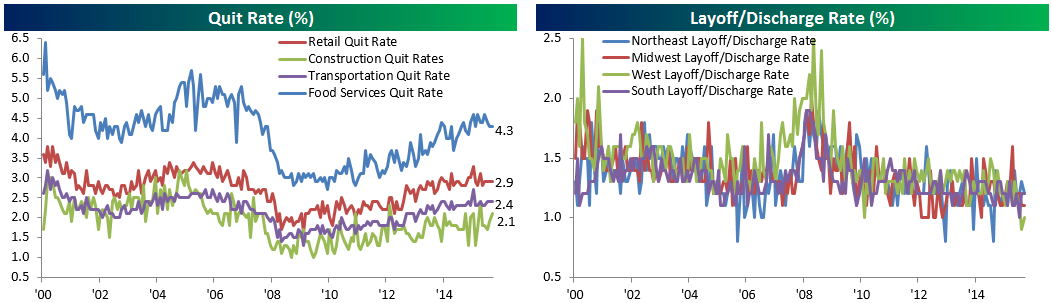
Chart of the Day – Fed Minutes Days
Today at 2PM, the FOMC will release the minutes from its September meeting where the committee left rates unchanged. They should be interesting as even though rates were left unchanged, three members dissented and that was the greatest number of dissenters to a policy statement in nearly two years (December 2014).
With that in mind, in today’s Chart of the Day, we looked at how the S&P 500 has performed on the day of and the day after previous releases of the FOMC Minutes so far in 2016. See today’s Chart of the Day by starting a 14-day free trial to Bespoke’s premium research below.
Another All or Nothing Day for the S&P 500
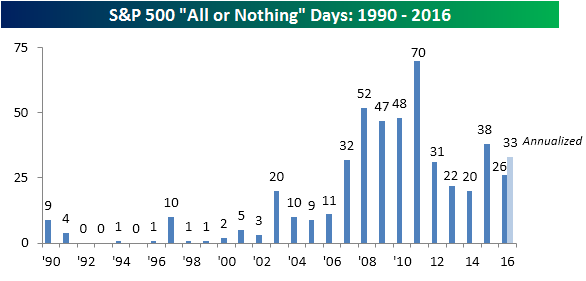
Like just about every other year, volatility in the market picked up as traders and investors came back from the beach in September. With a decline of over 1% today, the net advance/decline (A/D) reading on the S&P 500 registered -457, marking the sixth all-or-nothing day for the S&P 500 since Labor Day. For those not familiar with the term, we consider an “all-or-nothing day” to be any trading day where the net A/D reading for the S&P 500 is greater than +400 or less than -400. With today’s move, the S&P 500 has seen its 26th all-or-nothing day of the year, which puts the index on pace for 33 this year. At this rate, 2016 will come up short of the 38 occurrences in 2015 but still would rank as the sixth most number of occurrences for a given year since 1990.
Looking at the chart, you can also see a clear trend where the number of occurrences has increased as ETFs have gained in popularity. Because ETFs allow an investor to move an entire basket of stocks in one trade, the market has become increasingly one-sided in terms of its daily moves. On big up days, nearly everything rallies (‘all’), while on days like Tuesday, nearly everything declines (‘nothing’).
While the chart above shows that 2016 is on pace for 33 all-or-nothing days, the year could really come in anywhere from the current level of 26 to a much higher number. The reality is that all-or-nothing days tend to come in clusters, so if the market enters a period of increased volatility, we should see more frequent occurrences, whereas if volatility declines, the pace of all or nothing days will dry up. The occurrences of all-or-nothing days so far this year provides a perfect example. As shown in the chart below, outside of Tuesday’s occurrence and two in April and May of earlier this year, every other all-or-nothing day has occurred within 10 trading days of another one.

The Closer 10/11/16 – Pushing Down Pound
Looking for deeper insight on global markets and economics? In tonight’s Closer sent to Bespoke clients, we chart out the massive decline in GBP, which has had some interesting impacts. One of them is better performance for US equities from the perspective of UK investors.
The Closer is one of our most popular reports, and you can sign up for a trial below to see it and everything else Bespoke publishes free for the next two weeks!
Click here to start your no-obligation free Bespoke research trial now!
Pound Nearing ‘Flash Crash’ Lows
Last Thursday night, a sudden drop in an illiquid market between the US close and the Asian open sent the British Pound-US Dollar cross (GBP/USD) down to new post-Brexit lows. After breaking below 1.20, the pound hit levels not seen since 1985. While the pound quickly regained much of its initial decline, it has continued to trade lower over the last two days and is now considerably closer to its ‘flash crash’ low than it is to last Thursday’s regular session close. We would also note that while the pound dropped 8.1% in the day after the surprise Brexit vote results, it has fallen more than that (11.3%) since then. That puts the total decline for the pound since Brexit at 18.4%. Remember, this is the currency of what is (or what was) one of the five largest economies in the world.

Dollar Surges to New Six-Month High
The US Dollar index made another leg higher today, eclipsing resistance at its highs from mid-summer in the process. Below is a one-year candle chart of the Dollar index. You can see that the move higher over the last few days has caused a break above the top of the currency’s downtrend channel as well. This couple with the series of “higher lows” puts the Dollar in a clear short-term uptrend.
A rising dollar can cause a big impact on the performance of stocks. Under this scenario, you typically see investors rotate out of companies that generate most or all of their revenues outside of the US and into companies that generate most or all of their revenues domestically. If you’re a Bespoke Premium or Bespoke Institutional subscriber, you can access our International Revenues Database to track geographic revenue exposure for every stock in the Russell 1,000. This is a very useful tool for asset allocation and positioning purposes.
Access our International Revenues Database with a 14-day free trial to Bespoke Premium. Choose a monthly or annual subscription option now.

Chart of the Day – As Goes Alcoa…
With the company in the process of splitting up, being booted from the Dow Jones three years ago, and now sporting a market cap of less then $12.5 billion, you’re unlikely to get any brushback to the argument that Alcoa (AA) is no longer the economic bell-weather that it once was. However, given the company’s place in the chronology of earnings season, investors tend to focus on the market’s reaction to AA’s report as a sign of what to expect during earnings season. With the stock now down 10% following its report earlier today, investors are wondering whether this is a sign of things to come.
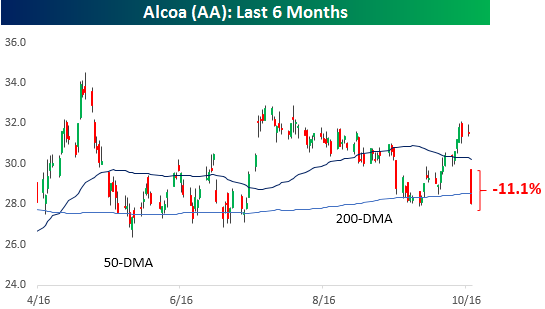
With that in mind, in today’s Chart of the Day, we looked at what, if any, relationship there has historically been between how Alcoa reacts to its quarterly earnings report and how the rest of the equity market performs during earnings season. See today’s Chart of the Day by starting a 14-day free trial to Bespoke’s premium research below.
A Few Sector Earnings Season Stats
This morning we did a post highlighting historical earnings beat rates for US companies during earnings season. Below we dive into sectors with a few additional data points.
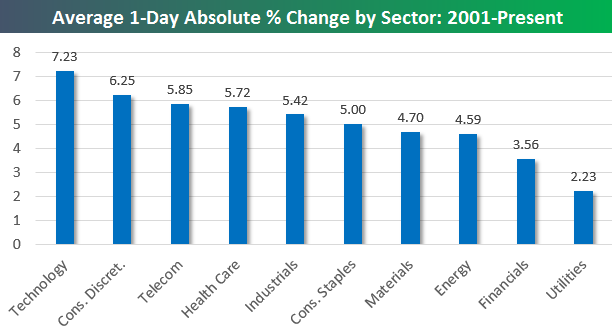
The first chart below shows the average price change that stocks in each sector typically experience on their earnings reaction days. (For companies that report in the morning before the open, that day’s trading is its earnings reaction day. For companies that report in the evening after the close, the next day’s trading is its earnings reaction day.)
As shown, Technology stocks are by far the most volatile on their earnings reaction days with an average absolute one-day change of +/-7.23%. That’s a huge move, but it’s one you can expect to experience for the average Tech stock essentially once every three months. Consumer Discretionary stocks are the second most volatile on earnings with an average one-day change of +/-6.25%, followed by Telecom (+/-5.85%), Health Care (+/-5.72%), and Industrials (+/-5.42%). On the flip side, Financial stocks are the second least volatile on earnings with an average one-day move of just +/-3.56%, and Utilities are the least volatile at +/-2.23%. Given their low-growth, defensive nature, it’s not surprising that Utilities stocks barely budge when they report quarterly numbers.
If you’re new to Bespoke or you’ve simply never looked into our research subscriptions, earnings season is a great time to try us out. Click here to start a 14-day no-obligation free trial. We’ll be updating the charts below and many other earnings-related data points all month long.
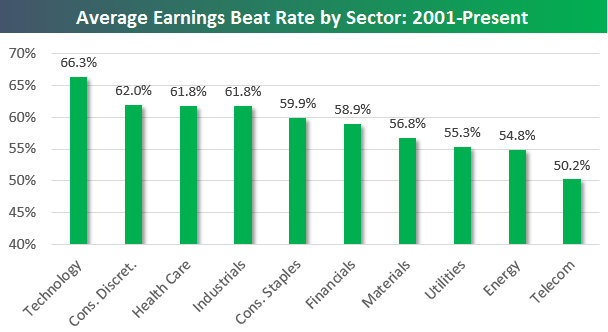
Below is the historical earnings beat rate (% of companies that beat consensus analyst earnings per share estimates) by sector going back to 2001. While Technology stocks are the most volatile on their earnings reaction days, they also beat earnings estimates at the highest rate (66.3%). That’s more than four percentage points better than the 62% beat rate for Consumer Discretionary in second place. On the flip side, even though they’re still above 50%, Utilities, Energy, and Telecom have the lowest earnings beat rates.
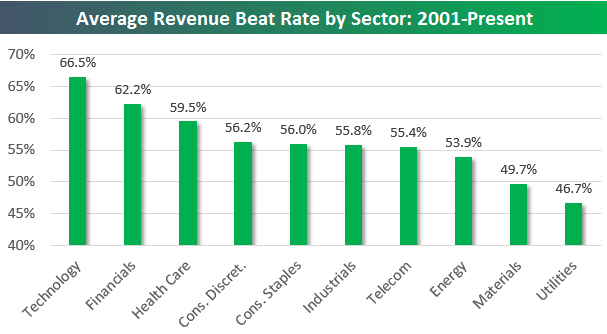
The Technology sector also has the highest top-line revenue beat rate at 66.5%, but it’s Financials — not Consumer Discretionary — that have the second highest revenue beat rate at 62.2%.
Start a 14-day free trial to see all of Bespoke’s in-depth, actionable research.