Quick-View Chart Book: 10/21/16
Bespoke Report – 10/21/16 “Market of the Living Dead”
Halloween is still more than a week away, but financial assets put their zombie costumes on early this year, as major equity averages and other asset classes meander around awkwardly and aimlessly. The S&P 500 traded to an all-time high more than two-months ago in mid-August and then quickly went catatonic, trading in a range of less than three percentage points. Eight years ago, in 2008, the S&P 500’s average daily move was 3% per day on its way to a peak of 4% that December. These days we can’t even get 3% in two months. Looking at the charts of the major US equity benchmarks, it is a similar picture. The DJIA, Nasdaq, and Russell 2000 are all hanging around right near their August highs, pinned between their 50 and 200-day moving averages.
In our just-published Bespoke Report newsletter, we analyze this week’s action, including economic data, earnings, and sentiment. You can read the entire report by starting a 14-day free trial to our paid content.

Have a great weekend!
Earnings Beat Rate Ticks Higher; Next Week’s Big Reports
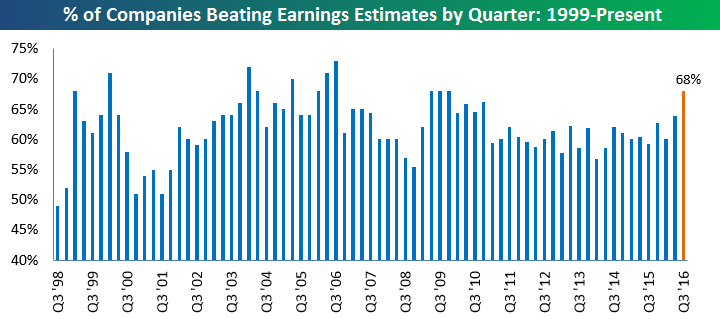
The first two weeks of the third quarter reporting period are in the books, and as shown in the chart below, 68% of companies that have reported so far this season have beaten consensus analyst earnings estimates. If the season were to end today, this “beat rate” would be the strongest since Q4 2009, but it’s likely to drift a bit lower in the coming weeks as more and more companies report.
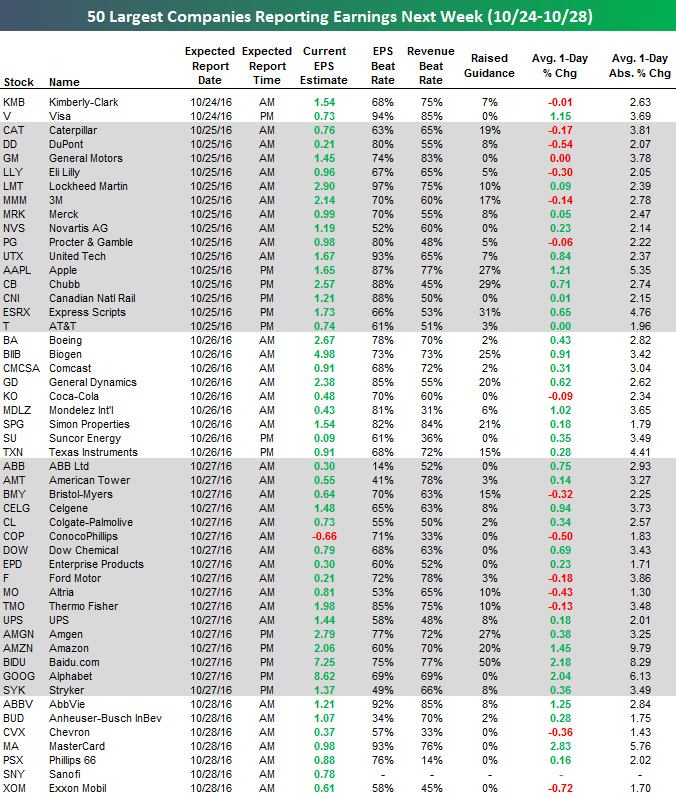
Next week is a huge one for earnings. On Thursday alone we’ll get 330 individual reports. Below is a list of the 50 largest companies set to report next week, with key stats from our Interactive Earnings Database included. On Monday, Visa (V) reports after the close, and then Caterpillar (CAT), 3M (MMM), Apple (AAPL), and United Tech (UTX) all report on Tuesday. Boeing (BA) and Biogen (BIIB) report on Wednesday, followed by Amgen (AMGN), Amazon (AMZN), and Alphabet (GOOGL) on Thursday. MasterCard (MA) and Exxon Mobil (XOM) round out the week with reports on Friday.
See all of Bespoke’s earnings season coverage with a 14-day free trial to our premium research.
Best Performing Stocks on Earnings This Season
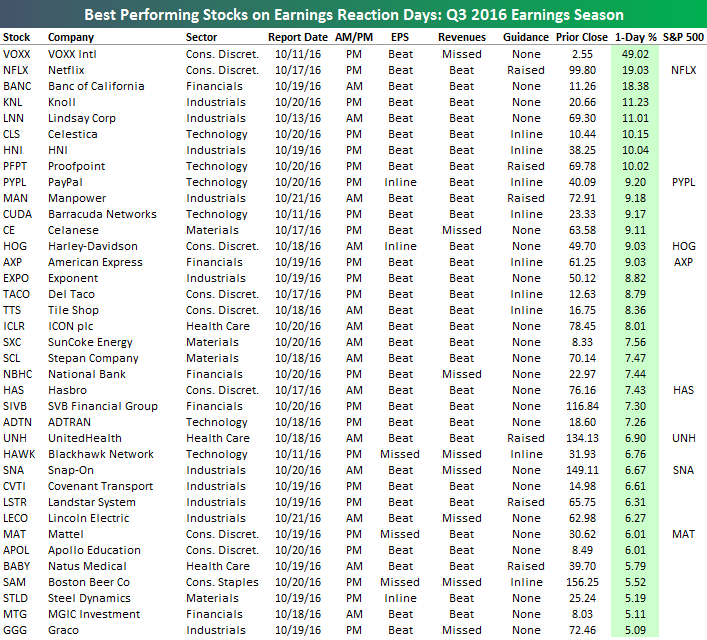
So far this earnings season, the average stock that has reported has gained 0.22% on its earnings reaction day. (For stocks that report in the morning, its earnings reaction day is that trading day. For stocks that report after the close, the earnings reaction day is the next trading day.)
Below is a list of the stocks that have performed the best on their earnings reaction days this season. The 37 stocks listed all gained 5% or more, with VOXX blowing away the field at +49%! Netflix (NFLX) ranks second best so far with a one-day gain of 19.03%, followed by Banc of California (BANC) at +18.38%. Other notables on the list of this season’s winners include Paypal (PYPL), Harley-Davidson (HOG), American Express (AXP), UnitedHealth (UNH), and Mattel (MAT).
See all of Bespoke’s earnings season coverage with a 14-day free trial to our premium research.
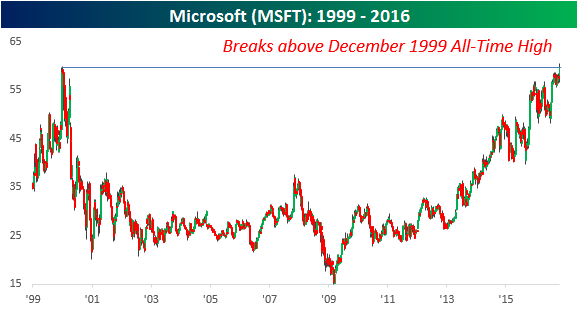
Biggest Winners and Losers While Microsoft Dug Out of its Hole
Shares of Microsoft (MSFT) crossed a major milestone today as the stock traded to an all-time high for the first time since December 1999. Over the span of nearly seventeen years, MSFT saw its share price decline 75% only to gain it all back in the last seven years.
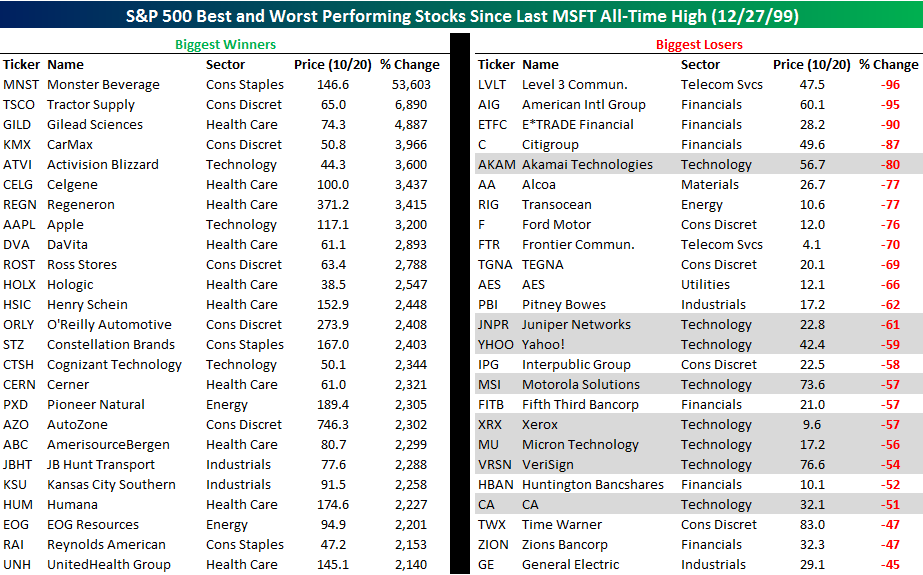
During this period that MSFT has been dead money, a lot of current members of the S&P 500 have done very well while others only wish they were unchanged since December 1999. To highlight this, the table below shows the biggest winners and losers from a screen we ran on the current members of the S&P 500 for their performance since 12/27/99. Of the current components in the index, 107 weren’t even in existence in their current publicly traded form when MSFT last made an all-time high. Of the remaining members, though, 56 are up over 1,000% compared to a gain of 50% for the S&P 500. MSFT used to be known for its quadruple-digit percentage gains, but in the last seventeen years it has past off that baton to a number of other companies.
Topping the list of winners is Monster Beverage (MNST), which is up 53,600%. To put that move in perspective, $1,000 invested in the company at the end of 1999 would be worth over half a million dollars today! The biggest standout on the list of biggest winners, though, it probably Apple (AAPL). The two companies were bitter rivals in the 1990s with MSFT getting the upper hand, but when the century turned, AAPL regained the spotlight. What is also interesting to note about the biggest winners is how few tech stocks there are. The part of the table where Technology is well represented is on the list of losers. As shown on the right side of the table, eight of the 25 biggest losers are Technology stocks. Many of these were also highfliers back in the late 1990s along with MSFT and to say that it has been rough seventeen years for them would be an understatement. In 1999, Technology was all the rage, but it just goes to show that chasing the hot stocks isn’t usually the way to achieve the highest returns.
Bespokecast — Episode 1 — Mark Dow
Bespoke is happy to introduce a brand new product today! “Bespokecast” is our new podcast series providing an in-depth discussion with a market professional whose views we find interesting or insightful into the world of finance and economics. We’re planning on doing one per month at this point, but if it’s well received, we may do it more often. Each conversation will run between 30-60 minutes, and Bespoke research clients will receive access one week before the podcast is made available to the general public.
This month, we spoke with International Monetary Fund and hedge fund veteran Mark Dow. Mark’s blog Behavioral Macro and his Twitter account @mark_dow are widely followed for their insights into macro investing, and he was kind enough to spend an hour with us discussing his background, trading strategy, views on some specific asset classes and the economy, and risk management. We hope you enjoy the discussion.
To access this week’s podcast immediately, start a 14-day free trial to Bespoke’s research product. If you’ve already used your Bespoke free trial, you can gain access by choosing a membership option at our products page.
The Closer 10/20/16 – Fresh Median Wage Data
Looking for deeper insight on global markets and economics? In tonight’s Closer sent to Bespoke clients, we give an overview of the latest report on median wage growth for workers as tracked by the Atlanta Fed’s Median Wage Growth tracker. As shown below, the tracker continues to show very strong wage growth, especially in real terms.

The Closer is one of our most popular reports, and you can sign up for a trial below to see it and everything else Bespoke publishes free for the next two weeks!
Click here to start your no-obligation free Bespoke research trial now!
Bespoke’s Sector Snapshot — 10/20/16
We’ve just released our weekly Sector Snapshot report (see a sample here) for Bespoke Premium and Bespoke Institutional members. Please log-in here to view the report if you’re already a member. If you’re not yet a subscriber and would like to see the report, please start a 14-day trial to Bespoke Premium now.
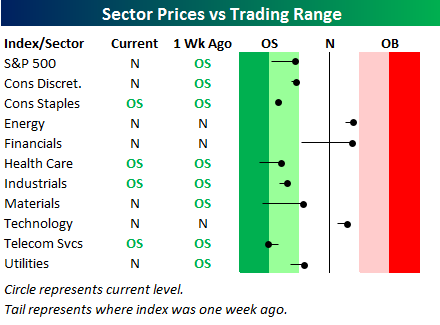
Below is one of the many charts included in this week’s Sector Snapshot, which is our trading range screen for the S&P 500 and its ten sectors. We discuss in more detail how to read the chart in the full version of the report, but basically the dot is where the sector is currently trading, while the tail end is where it was trading one week ago. As shown, the S&P 500 and six sectors are in neutral territory, while four sectors remain oversold — Consumer Staples, Health Care, Industrials, and Telecom. Energy, Financials, and Technology are the only three sectors above their 50-day moving averages.
To see our full Sector Snapshot with additional commentary plus six pages of charts that include analysis of valuations, breadth, technicals, and relative strength, start a 14-day free trial to our Bespoke Premium package now. Here’s a breakdown of the products you’ll receive.