ETF Trends: US Indices & Styles – 10/25/16
Steel producers retain their place as the best performers over the last five days, while coffee has also seen a fairly significant rally over the past week. Other miners, like gold miners, have performed well, while banks have been a beneficiary of higher interest rates. South Africa, Brazil, Poland, and Turkey have led emerging markets higher over the last give sessions. On the other side of the performance slate, natural gas continues to decline, by far the worst performer in the ETFs we track. Homebuilders have also been hit very hard relative to the rest of the ETF universe over the last few days.

Bespoke provides Bespoke Premium and Bespoke Institutional members with a daily ETF Trends report that highlights proprietary trend and timing scores for more than 200 widely followed ETFs across all asset classes. If you’re an ETF investor, this daily report is perfect. Sign up below to access today’s ETF Trends report.
See Bespoke’s full daily ETF Trends report by starting a no-obligation free trial to our premium research. Click here to sign up with just your name and email address.
Bespoke Stock Scores: 10/25/16
Home Prices Approaching New Highs — August 2016 Case-Shiller Numbers
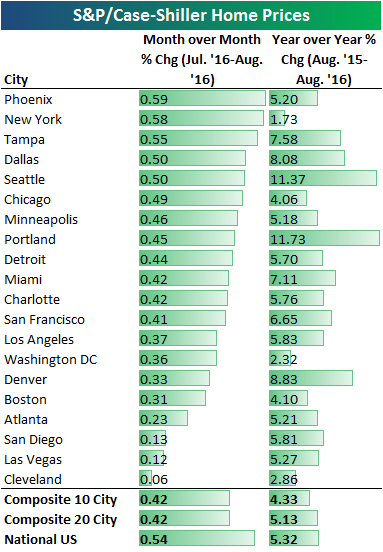
The August data for S&P/Case-Shiller’s home price indices was released today, and it showed month-over-month growth of 0.42% for both the 10-city and 20-city composite indices. Year-over-year versus last August, the 10-city was up 4.33% while the 20-city was up 5.13%. As shown below, Phoenix, New York, Tampa, Dallas and Seattle grew the most month-over-month, while San Diego, Las Vegas, and Cleveland grew the least. New York was up the second most month-over-month, but it’s up the least year-over-year at just 1.73%. Is the monthly reading a sign that New York is finally set to see a pick-up in prices?
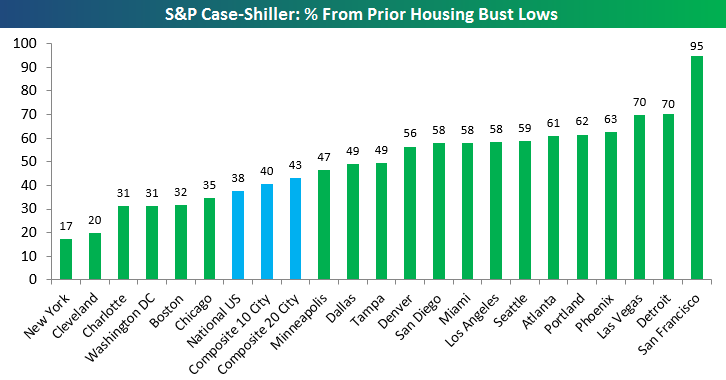
The chart below shows how much each of the cities tracked by Case-Shiller have seen prices rise since their late-2000s housing bust lows. As shown, the national composite indices are all up roughly 40% from their lows at this point, but San Francisco has nearly doubled with an increase of 95%. Detroit and Las Vegas have seen the second biggest gains at +70%, followed by Phoenix, Portland and Atlanta, which are all up just over 60%. On the bottom end is New York with a gain of just 17% from its lows, and Cleveland with a gain of 20%. Charlotte, DC, Boston and Chicago have all seen below-average gains as well.
The chart below compares current prices for each city to their peaks during the housing bubble in the mid-2000s. As of now, the National US index is just a hair below its prior bubble highs, which is an amazing thing. The 20-city composite is still 7% below its prior highs, while the 10-city is still 9% below. Even still, seven of the twenty cities tracked have seen home prices rise above their prior housing bubble highs, and Denver and Dallas prices are more than 30% above their prior highs.
The main cities that still have a ways to go to get back to their prior highs are Las Vegas, Phoenix, Miami and Tampa. These are areas of the country that saw the most speculative prices during the housing bubble, and they also saw the biggest crashes when the bubble burst.

You can track trends in home prices for each city going back to 1989 using the charts below. Cities shaded in green are ones where prices have eclipsed their prior bubble highs from back in 2005-2006.
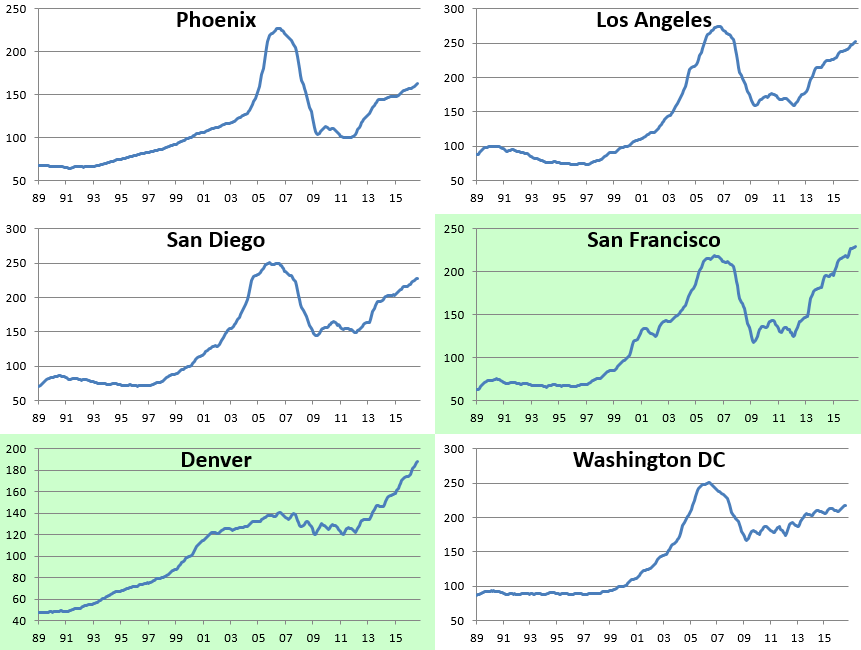
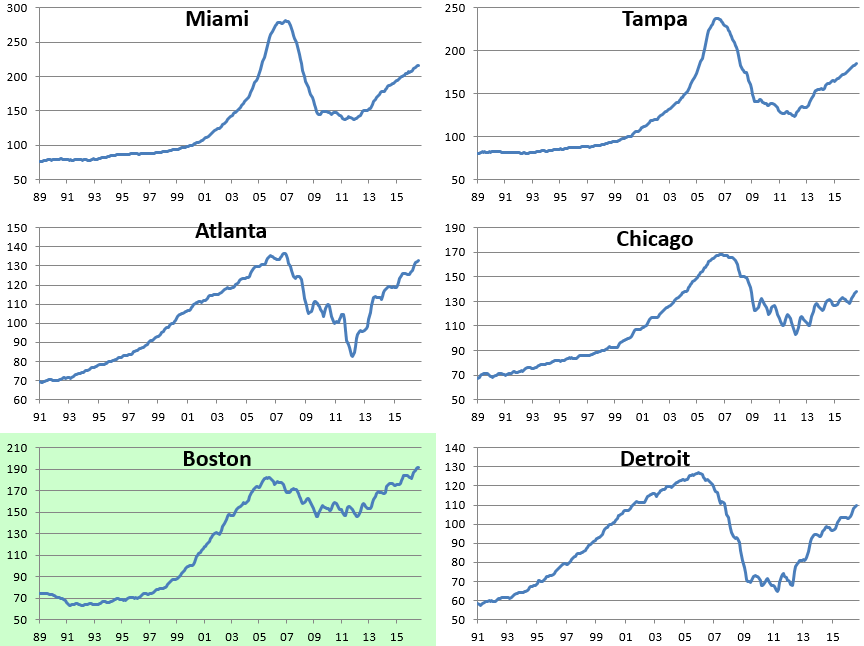
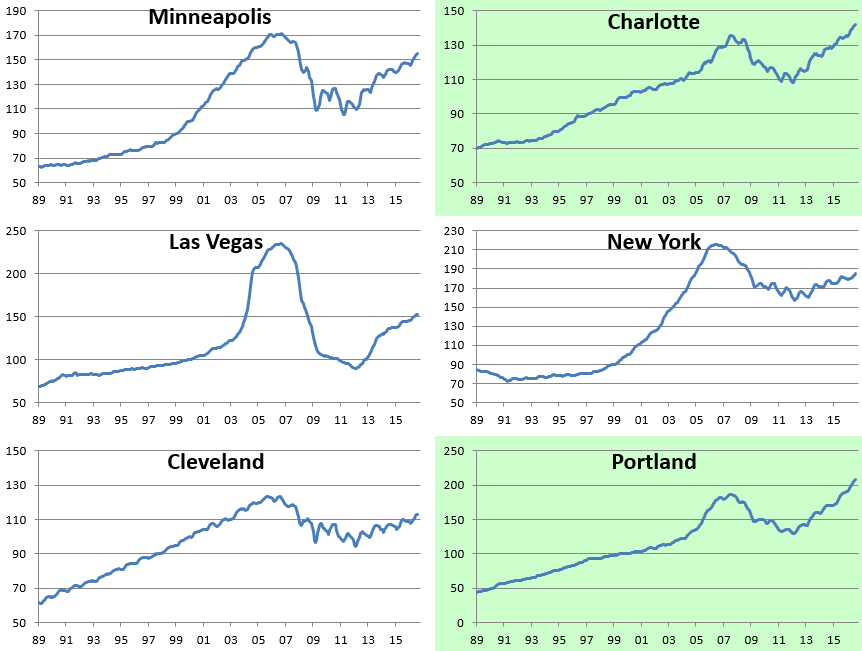
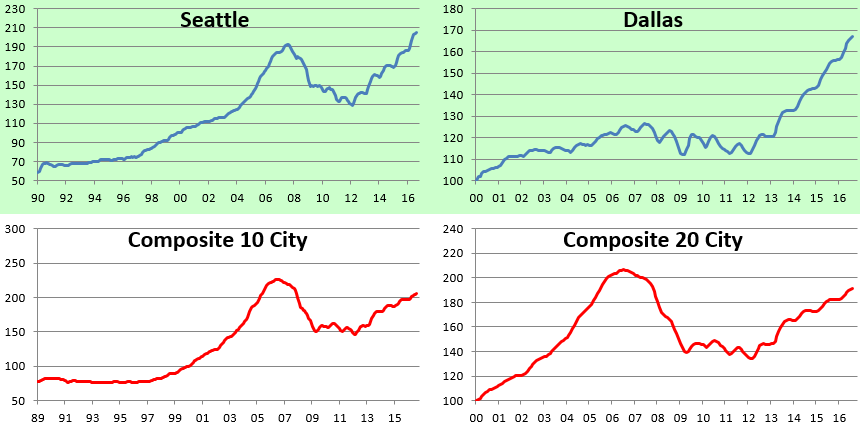
Chart of the Day: Guidance Remains Relatively Good
B.I.G. Tips – Caterpillar Sales Stable
All Time Highs For The Market’s Largest Stocks
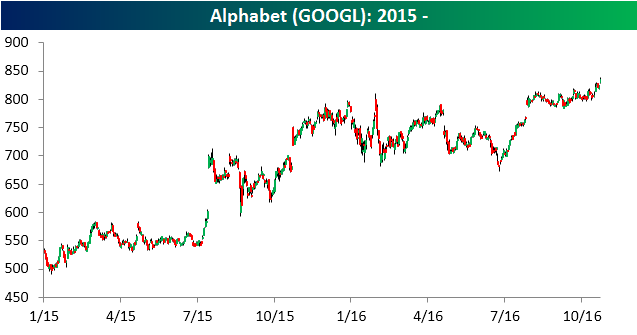
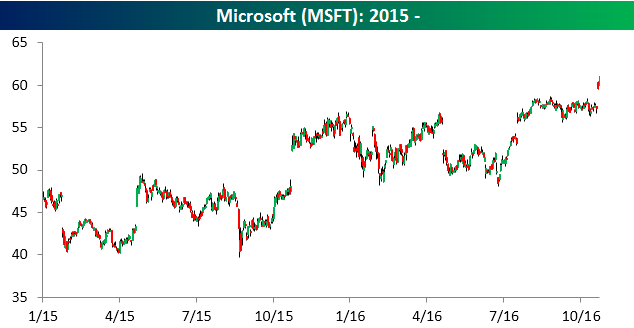
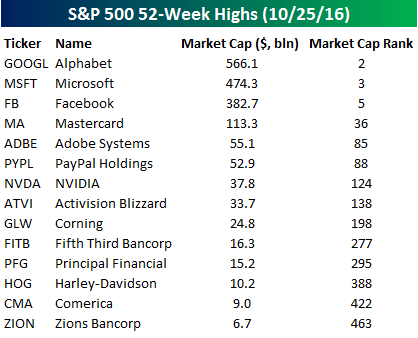 In terms of new highs in yesterday’s trading, it was a pretty unremarkable day. As shown in the table at right, just 14 stocks in the S&P 500 made new 52-week highs. What is noteworthy about the list, though, is the stocks that did hit new highs. Looking at the names, Tech is well represented. More importantly, though, of the 14 stocks listed, three of them are among the five largest companies in the S&P 500. As shown at the top of the list, Alphabet (GOOGL), Microsoft (MSFT), and Facebook (FB), which rank as the second, third, and fifth largest publicly traded US companies and represent more than $1.4 trillion market cap, all hit new 52-week highs.
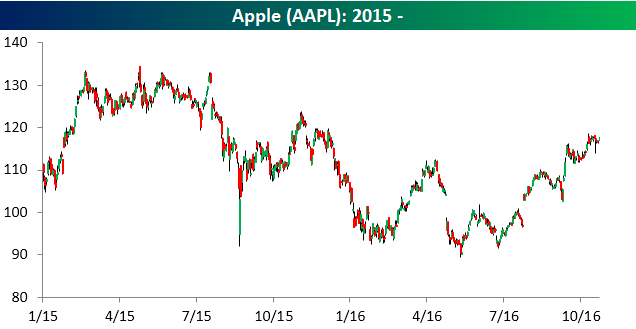
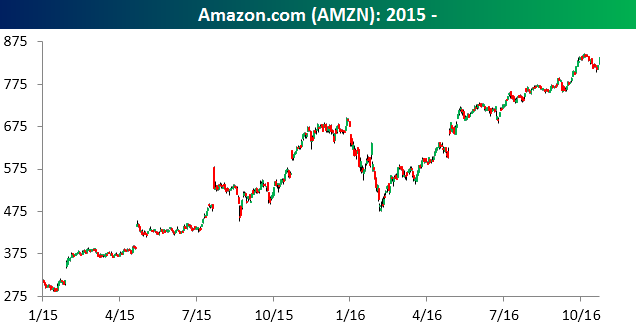
Not only did these three stocks hit new 52-week highs yesterday, but they also traded to new all-time highs. Below we show the charts of the five largest US companies, which includes the three stocks mentioned above as well as Apple (AAPL) and Amazon.com (AMZN). While shares of AAPL (the largest US company) are still 13% off their all-time high of $134.54 back in April 2015, shares of AMZN (number four on the list) are currently just 1% from their all-time high of $847.21 earlier this month. While overall market breadth hasn’t been bad, the largest stocks in the S&P 500 have definitely been doing a lot of the heavy lifting.
Like what you see? Sign up for a free trial to Bespoke’s paid research and receive access to everything we have to offer. No credit card is required.

The Closer 10/24/16 – CFNAI Bounce To Modest Levels
Looking for deeper insight on global markets and economics? In tonight’s Closer sent to Bespoke clients, we discuss today’s report from the Chicago Fed on their National Activity Index.

The Closer is one of our most popular reports, and you can sign up for a trial below to see it and everything else Bespoke publishes free for the next two weeks!
Click here to start your no-obligation free Bespoke research trial now!
Chart of the Day: Earnings Season Triple Plays
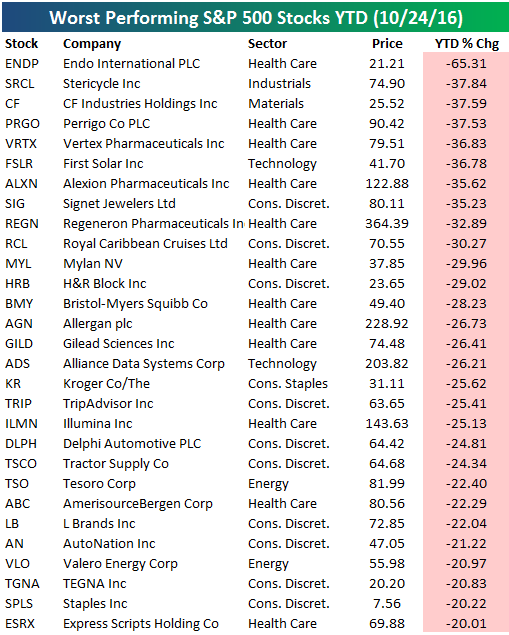
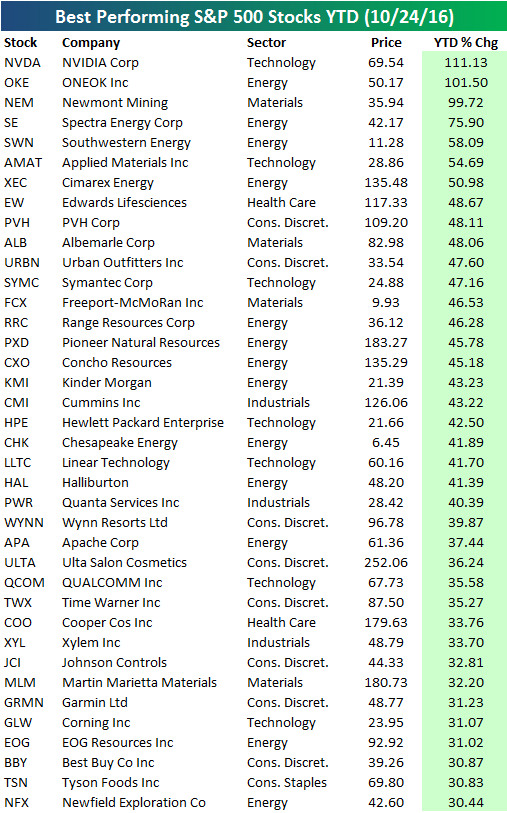
Best and Worst Performing Stocks 2016 YTD
The average stock in the S&P 500 is up 7.01% year-to-date as of 10/24/16. Within the index, 64% of members are in the green for the year, while 36% are in the red. A total of 29 stocks in the index are down more than 20% year-to-date, while 100 stocks in the index are up more than 20%. However, although a fifth of the index is up more than 20%, just 7 stocks are up more than 50%, and 2 are up more than 100%. You typically see a few more big winners in an up year like this one.
Nonetheless, the two stocks in the S&P that are sitting on triple-digit percentage gains year-to-date are NVIDIA (NVDA) and ONEOK (OKE). It looks like using all caps for your company name is a winning strategy! Newmont Mining (NEM) ranks third with a gain of 99.72% (nope, we’re not rounding up on this one), while Spectra Energy (SE) and Southwestern Energy (SWN) round out the top five. Notably, 3 of the 5 best performing stocks are from the Energy sector. Other notables on the list of 2016’s big winners include Urban Outfitters (URBN), Halliburton (HAL), Wynn Resorts (WYNN), QUALCOMM (QCOM), Time Warner (TWX), and Best Buy (BBY).
Below is a list of the S&P 500 stocks down more than 20% year-to-date. Endo (ENDP) tops the list of losers with a decline of 65.31%. That’s nearly double the next worst stock, which is Stericycle (SRCL) at -37.84%. Other notables on the list of losers include First Solar (FSLR), Bristol-Myers (BMY), Gilead Sciences (GILD), TripAdvisor (TRIP), and Staples (SPLS). Twelve of the 29 stocks down 20%+ this year are from the Health Care sector.