Bespoke Stock Scores: 11/1/16
B.I.G. Tips – October 2016 Decile Analysis
Chart of the Day – Last Hour Misery in October
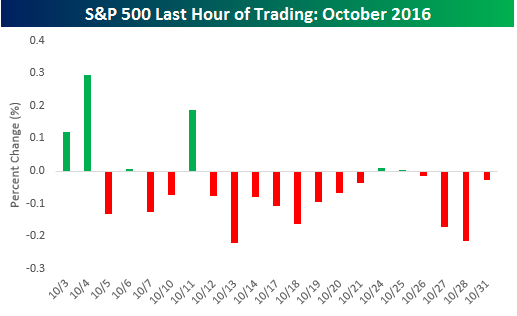 If you are a bull and aren’t an early riser, October wasn’t the month for you. As shown in the chart to the right, of the 21 trading days in the month, the S&P 500 was up in the last hour of trading just six times. Even worse, in the last 14 trading days of October, the S&P 500 traded up in the last hour of trading just twice, and the best it could muster in those two days was a gain of 0.009%! Using our S&P 500 Intraday Database, we looked to see how October 2016 stacks up against other months going back to 1983 and found the lack of upside momentum in the last hour of trading was one of the weakest we have seen of any month since 1983.
In today’s Chart of the Day, we looked at other months where the S&P 500 saw such a preponderance of days where the S&P 500 was down in the last hour of trading and calculated how the overall market performed going forward. See today’s Chart of the Day by starting a 14-day free trial to Bespoke’s premium research below.
ETF Trends: US Indices & Styles – 11/1/16
Previous metals have ripped over the last couple of days, while steel and other industrial metals have also risen notably. Breadth within the US equity market continues to look poor with numerous indices and sectors in significant downtrends. Oil at recent lows hasn’t helped, and health care industry indices continue to plunge, with pharma and biotech leading the way. Bond selloffs have also hurt REITs and other real estate-related names.

Bespoke provides Bespoke Premium and Bespoke Institutional members with a daily ETF Trends report that highlights proprietary trend and timing scores for more than 200 widely followed ETFs across all asset classes. If you’re an ETF investor, this daily report is perfect. Sign up below to access today’s ETF Trends report.
See Bespoke’s full daily ETF Trends report by starting a no-obligation free trial to our premium research. Click here to sign up with just your name and email address.
October Asset Class Performance
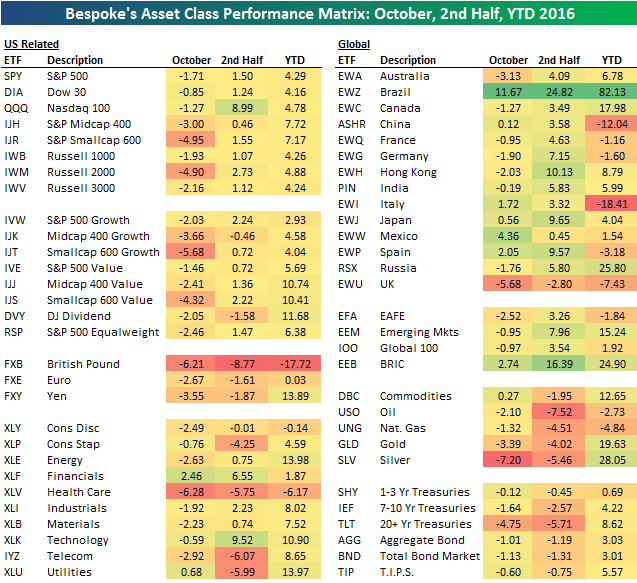
October is behind us, and it wasn’t a great month for market bulls. The S&P 500-tracking SPY ETF was down 1.71%, and the average stock in the index was down even more at -2.39%. Mid-caps did worse than large-caps, and small-caps did worse than mid-caps. The Russell 2,000 ETF — IWM — finished October down 4.9%.
Looking at S&P 500 sectors, Financials (XLF) and Utilities (XLU) were the only two that gained in October, while Health Care (XLV) took a big hit with a drop of 6.28%. Consumer Discretionary (XLY), Energy (XLE), Telecom (IYZ), and Materials (XLB) were all down more than 2%.
Outside of the US, Brazil (EWZ) continued its epic 2016 run with a gain of 11.67% in October. EWZ is now up 82% year-to-date. Aside from Brazil, Mexico (EWW) saw the next biggest gain at +4.36%, followed by Spain (EWP), Italy (EWI), and Japan (EWJ). The UK (EWU) fell the most of the country ETFs in our matrix with a drop of 5.68%.
The broad commodities ETF — DBC — ended pretty much flat for the month, which leaves it up 12.65% year-to-date. Oil (USO) and natural gas (UNG) fell marginally in October, while gold (GLD) and silver (SLV) fell 3.39% and 7.20%, respectively. Finally, the 20+ Year Treasury ETF (TLT) saw a big drop in October as interest rates rose. For the month, TLT fell 4.75%, leaving it down 5.71% in the second half but still up 8.62% on the year.
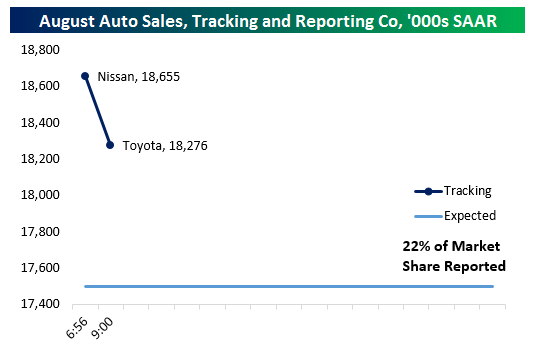
October Auto Sales Tracking Starts Strong
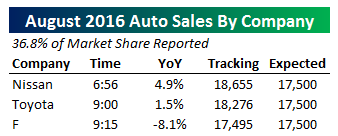 The first report on October sales from the US auto industry was a monster, with GM moving 258,626 vehicles off lots in the month, down 1.7% YoY but well above estimates of a decline in the neighborhood of 6% YoY. That print alone would put industry sales at seasonally adjusted annual rate of 18.695 million by our estimates, but to be clear it’s not likely the rest of the industry can sustain that sort of sales beat pace as they announce throughout the day. The second report saw Fiat-Chrysler announced a sales decline of 9.7% YoY versus -10% expected. The combined reading from GM and Fiat-Chrysler shows a sales pace just above 18mm SAAR, much stronger than the forecast of 17.6mm.
We will update our tracker as more companies report, but we should note that due to a fire in their headquarters, Ford will not be reporting sales figures today. Since Ford is about 15% of the market, the final tracking number will have to be asterisked.
Update 1 10:13 AM EST: With Nissan and Mazda reporting in the last 15 minutes, we’ve now gotten 42% of the industry’s figures. As shown, tracking is holding steady around 18mm SAAR. While sales are down double-digits since last October for two companies and lower for all reported companies, it might be confusing that SAAR is still coming in strong. Keep in mind, there were two fewer selling days this month, 26 instead of 28 in October 2015. That’s why the combined seasonal and day-trade adjustment for the industry as a whole is 91.37 by our estimate based on BEA figures for each class of car (NSA sales are bumped up by 8.63%) rather than the 96.24 (a seasonal and day-trade adjustment of 3.76%) last year. Keep this in mind when looking at headline sales figures only!
Update 2 11:02 AM EST: Hyundai and Volkswagen have now reported, bringing total market share reported up to 48%. Volkswagen continues to struggle with the fallout of its diesel engine emissions scandal, as sales dropped 18.5% YoY. Hyundai reported very strong results, and although they account for only 4.2% of market share they pushed tracking up over 150,000 SAAR with their 4.2% YoY sales gain. It’s also worth noting that if the current sales pace holds, October will have the highest US auto sales pace of the current expansion.
Update 3 2:07 PM EST: With 84.1% of the industry reported, US Auto SAAR is tracking 18.138mm for the month of October by our math. As we mentioned above, that comes with an asterisk. Ford suffered a fire at their headquarters and will not report sales figures today, so we have to go with analyst estimates for that company, which is about 15% of US market share. If we include analyst estimates for Ford, auto sales probably came in around 17.956mm SAAR versus 17.6mm expected. The difference between an in-line report and beat from Ford could be the difference between an auto sales record for this expansion (previously 18.02mm SAAR per Ward’s Auto, in October 2015) and a solid, above-estimates print that builds on a decent run from YTD lows in June.
Dynamic Upgrades/Downgrades: 11/1/16
The Closer 10/31/16 – Scary Health Care Inflation Spooks Real Growth
Looking for deeper insight on global markets and economics? In tonight’s Closer sent to Bespoke clients, we take a look at the details of the Personal Income & Spending report from the BEA today. We also look at Chicago PMI from earlier today and the signal being sent by the CBOE Put/Call ratio at 3 month highs.

The Closer is one of our most popular reports, and you can sign up for a trial below to see it and everything else Bespoke publishes free for the next two weeks!
Click here to start your no-obligation free Bespoke research trial now!
Zombie Market
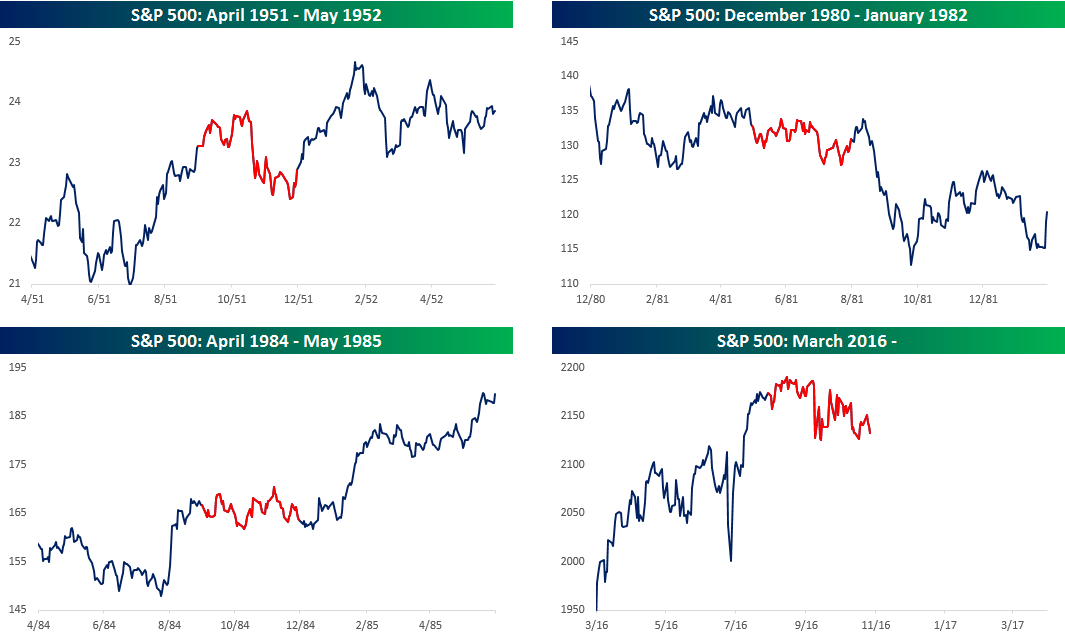
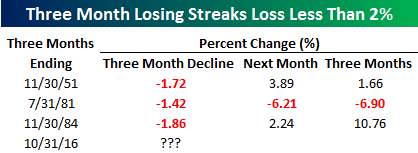 The S&P 500 is on pace for its third monthly decline in a row, but by all accounts it has been one of the tamest three-month losing streaks in history. Barring a huge decline this afternoon (on the order of 1.5%), the last three months will go down as at least the fourth smallest percentage decline during a three-month losing streak on record. Furthermore, if the S&P 500 closes above 2,130.13, it will be only the fourth time that the S&P 500 was down for three straight months and declined less than 2%. In the table to the right and the charts below, we highlight each of the three prior periods where the S&P 500 declined less over a three-month span.
Following two of the prior three periods, the S&P 500 was up over the following one and three months, but in August 1981, the index declined 6.21% on its way to a three-month decline of nearly 7%. Looking at the charts below, one key difference between the 1981 period and the other three periods is that in 1981, the S&P 500 was already trending lower heading into its streak, while in the other two periods (and the current streak), the S&P 500 was trending higher.