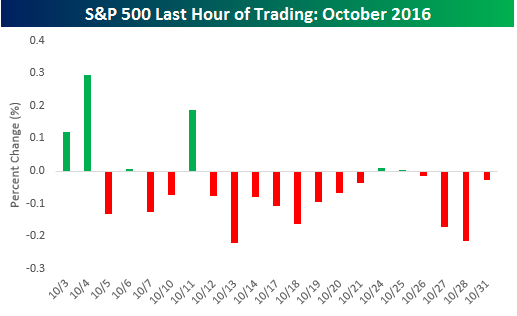
 If you are a bull and aren’t an early riser, October wasn’t the month for you. As shown in the chart to the right, of the 21 trading days in the month, the S&P 500 was up in the last hour of trading just six times. Even worse, in the last 14 trading days of October, the S&P 500 traded up in the last hour of trading just twice, and the best it could muster in those two days was a gain of 0.009%! Using our S&P 500 Intraday Database, we looked to see how October 2016 stacks up against other months going back to 1983 and found the lack of upside momentum in the last hour of trading was one of the weakest we have seen of any month since 1983.
In today’s Chart of the Day, we looked at other months where the S&P 500 saw such a preponderance of days where the S&P 500 was down in the last hour of trading and calculated how the overall market performed going forward. See today’s Chart of the Day by starting a 14-day free trial to Bespoke’s premium research below.
