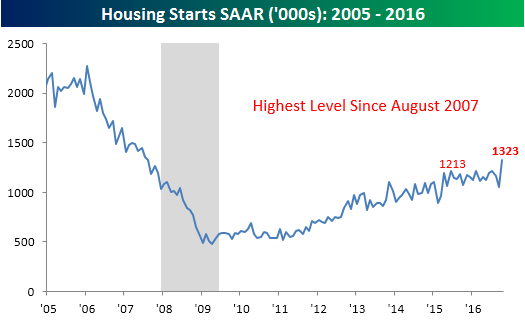
Housing Starts Spike to New Cycle Highs
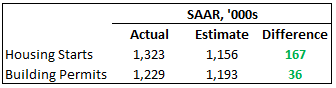 Although Thursday’s Jobless Claims report was pretty impressive, the report on Housing Starts and Building Permits put it to shame. October’s reading on Housing Starts came in at a SAAR reading of 1.323 million versus consensus expectations of 1.156 million. That difference of 167K was the biggest beat relative to expectations since January 2006! While Building Permits weren’t quite as strong relative to expectations, in any other month a beat of 36K would have been impressive.
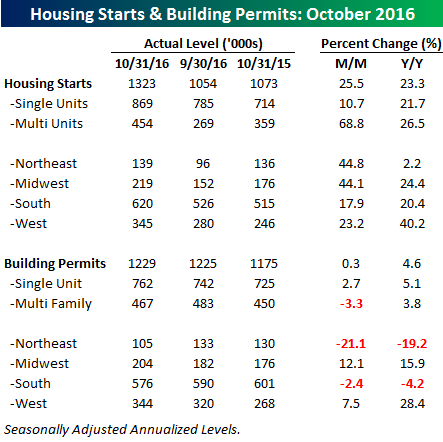
The table below breaks down this month’s report by type of unit and region. For Housing Starts, the m/m and y/y gains were flat out ridiculous. The 25.5% m/m gain was the fourth largest increase of all time, and the biggest since 1982. Looking at the details of the report, though, most of the strength was in multi-family units which increased 69%. Keep in mind, however, that these gains in multi-family units come on top of a pretty dismal showing for the category in September. Building Permits were a lot more subdued in October’s report. Overall, Permits increased just 0.3% m/m, with all the strength coming from single-family units, which increased 2.7%, while multi-family units declined 3.3%. The key point to remember when looking at multi vs single family units is that single family are generally considered to be more impactful from an economic perspective.
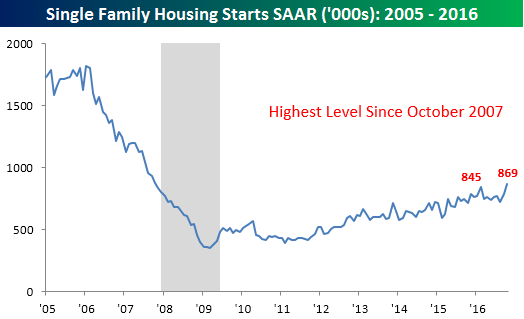
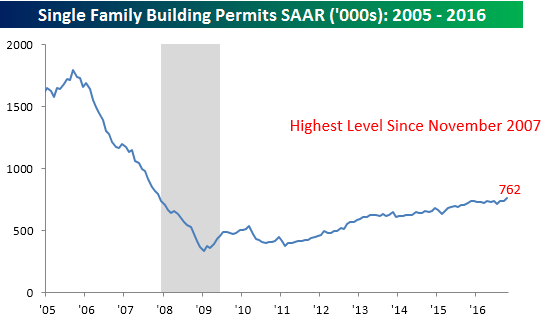
While much of the strength in this month’s Housing Starts may have been due to a strong showing in multi-family units, we would note that for both single-family starts and permits, October’s reading represented a new high for the cycle.
Philly Fed Slightly Weaker
Today’s report on manufacturing activity in the Philadelphia region was slightly weaker than expected (7.6 vs 7.8) and down slightly from last month’s reading of 9.7. For a report as volatile as this one, though, the magnitude of the miss is pretty negligible. This month’s report marked the fourth straight month where the headline index was positive, and while that may not sound like much, that’s the first time it has happened since the middle of 2015.

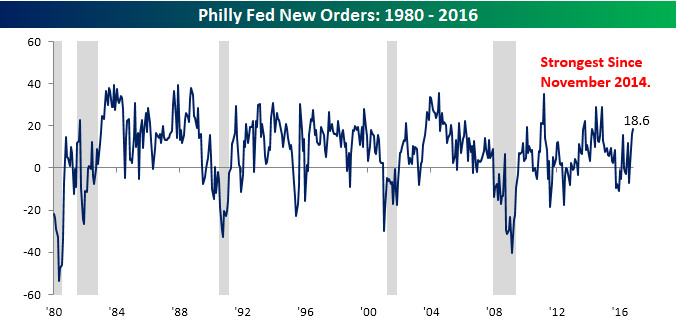
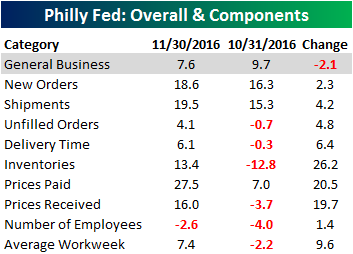 The table to the right breaks down this month’s report by each of its subcategories. While the headline reading of General Business conditions declined this month, every one of the sub categories showed improvement, with the largest gains coming from Inventories, Prices Paid, and Prices Received. In the case of Inventories, this month’s increase comes on the heels of a sharp decline last month, so the two months are essentially just netting each other out. For Prices Paid and Received, both are now currently at the high end of their range in the last couple of years. Finally, New Orders didn’t see an especially large increase this month, but still managed to hit its highest level since November 2014.
the Bespoke 50 — 11/17/16
Jobless Claims Back Down to Four Decade Low
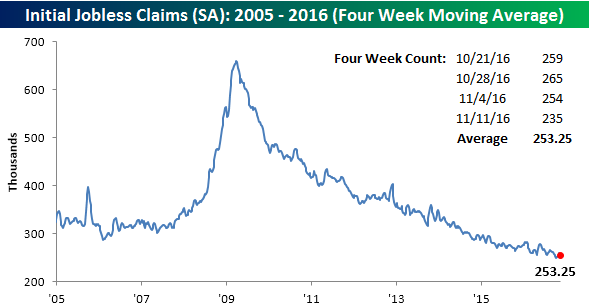
An economic data release isn’t something you would normally get overly excited about, but this morning’s jobless claims report just makes you saw, “Wow.” For months, if not years now, jobless claims have been dropping to levels that economists thought couldn’t get much lower, and yet here we are this week with another new multi-year low. While economists were expecting first time claims to come in at a level of 257K versus last week’s tally of 254K, the actual reading came in 22K lower at 235K. That was the best reading relative to expectations since July 2015 and the lowest weekly reading since 1973!
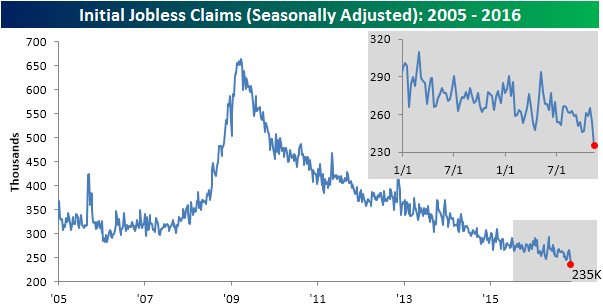
With this week’s sharp decline in jobless claims, the four-week moving average declined to 253.5K from last week’s level of 260K. That’s still 4K above the cycle low of 249.5K reached six weeks ago, but has yet to make a new cycle low. Another week like this one, though, and the four-week moving average will also make a new low.
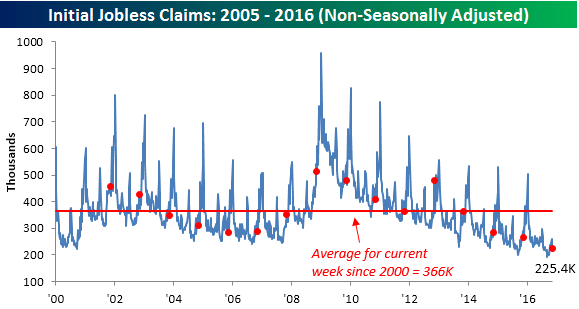
On a non-seasonally adjusted (NSA) basis, this week’s jobless claims report was even better than the seasonally adjusted number. This week’s NSA reading dropped 33.2K down to 225.4K. For the current week of the year, that’s more than 140K below the average for the current week of the year since 2000 and the lowest level since 1969.
Dynamic Upgrades/Downgrades: 11/17/16
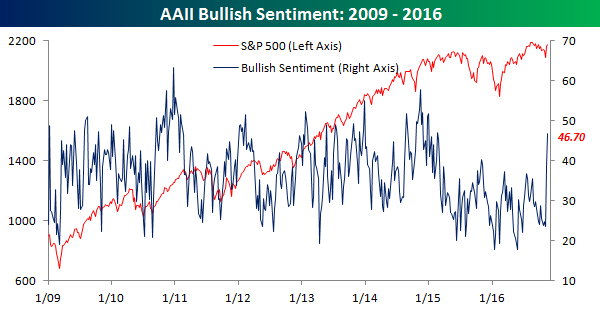
Bulls Break Out
He’s only been the president-elect for a week, but Donald Trump can already claim victory in terms of market sentiment. After a record 54 weeks where AAII’s weekly bullish sentiment reading was below 40%, this week’s reading, which was the first survey to be fully conducted after the election, surged above 40% for the first time since October 2015. After increasing from 23.6% to 38.9% in last week’s survey, which straddled the election, this week saw another 7.8 percentage point increase to 46.7%. The last time bullish sentiment was this high was all the way back in February 2015! Since the bull market began in 2009, there have only been two other periods where bullish sentiment saw a larger two week increase than the last two weeks.
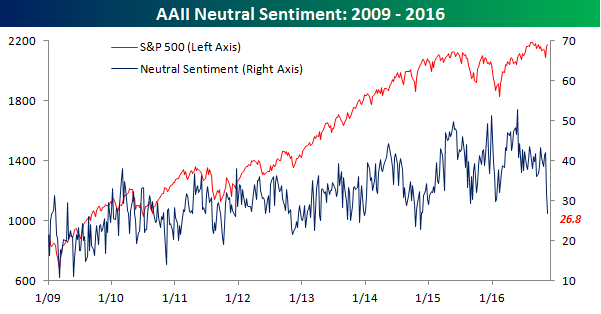
As one might expect given the increase in bullish sentiment, bearish sentiment declined this week, falling from 29.3% down to 26.6%. The bulk of the new bulls, however, came from the neutral camp which shrunk five percentage points down to 26.8%. As shown in the chart below, there haven’t been this few ‘undecideds’ on the market in two years (November 2014). The general consensus heading into the election was that a Trump Presidency would bring with it a big increase in market uncertainty, but for individual investors, things apparently haven’t been this certain in quite some time.
The Closer 11/16/16 – EIA, PPI, IP
Looking for deeper insight on global markets and economics? In tonight’s Closer sent to Bespoke Institutional clients, we update tracking of petroleum inventories and analyze today’s producer price index and industrial production releases.

The Closer is one of our most popular reports, and you can see it and everything else Bespoke publishes by starting a no-obligation 14-day free trial to our research!
Chart of the Day – Thanksgiving Returns
B.I.G. Tips – Years Like 2016: November Edition
ETF Trends: Hedge – 11/16/16
Banks continue to pace ETF gains over the past week but there was a big slowdown today. KRE and KBE were both down in the neighborhood of 1.5%. The rally in the micro caps continued, and small caps in general litter the top performers list. Retail is also up there, helped both by Trump’s election and the very strong retail sales numbers reported yesterday. Worst performers belong to gold, EM, and commodities. It’s been an absolute mess for EM equities (especially priced in USD, as ETFs are) over the past couple of weeks.

Bespoke provides Bespoke Premium and Bespoke Institutional members with a daily ETF Trends report that highlights proprietary trend and timing scores for more than 200 widely followed ETFs across all asset classes. If you’re an ETF investor, this daily report is perfect. Sign up below to access today’s ETF Trends report.
See Bespoke’s full daily ETF Trends report by starting a no-obligation free trial to our premium research. Click here to sign up with just your name and email address.