The Closer 12/1/16 – Constructing PMIs
Log-in here if you’re a member with access to the Closer.
Looking for deeper insight on global markets and economics? In tonight’s Closer sent to Bespoke Institutional clients, we chart construction spending, global PMIs, and today’s US auto sales data from major manufacturers.

The Closer is one of our most popular reports, and you can see it and everything else Bespoke publishes by starting a no-obligation 14-day free trial to our research!
ETF Trends: US Indices & Styles – 12/1/16
Natural gas, crude oil, and anything related to Energy has surged over the last few days thanks to OPEC’s decision to cut output. Italy, Singapore, and gold miners have also performed pretty well while banks are up over 2% over the past couple of weeks. Performing poorly: biotechs, semis (a recent leader) and growth stocks. Micro Caps (which exploded higher after the election) have also performed fairly poorly over the last few days.

Bespoke provides Bespoke Premium and Bespoke Institutional members with a daily ETF Trends report that highlights proprietary trend and timing scores for more than 200 widely followed ETFs across all asset classes. If you’re an ETF investor, this daily report is perfect. Sign up below to access today’s ETF Trends report.
See Bespoke’s full daily ETF Trends report by starting a no-obligation free trial to our premium research. Click here to sign up with just your name and email address.
Bespoke’s Sector Snapshot — 12/1/16
We’ve just released our weekly Sector Snapshot report (see a sample here) for Bespoke Premium and Bespoke Institutional members. Please log-in here to view the report if you’re already a member. If you’re not yet a subscriber and would like to see the report, please start a 14-day trial to Bespoke Premium now.
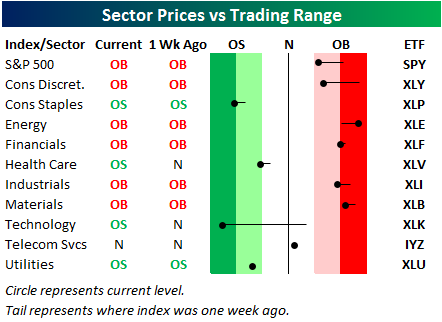
Below is one of the many charts included in this week’s Sector Snapshot, which is our trading range screen for the S&P 500 and its ten sectors. We discuss in more detail how to read the chart in the full version of the report, but basically the dot is where the sector is currently trading, while the tail end is where it was trading one week ago. While the S&P 500 remains slightly in overbought territory, the Technology sector has seen a massive pullback this week into extreme oversold territory.
To see our full Sector Snapshot with additional commentary plus six pages of charts that include analysis of valuations, breadth, technicals, and relative strength, start a 14-day free trial to our Bespoke Premium package now. Here’s a breakdown of the products you’ll receive.
November 2016 Headlines
November Employment Report Preview
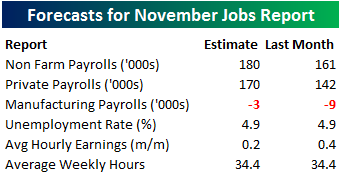 Heading into tomorrow’s Non Farm Payrolls (NFP) report for November, economists are expecting an increase in payrolls of 180K, which would be a 19K increase from last month’s weaker than expected reading of 161K. In the private sector, economists are expecting an increase of 170K, which would be an improvement of 28K from October. The unemployment rate is forecasted to remain unchanged at 4.9%. Growth in average hourly earnings is expected to slow to 0.2% from last month’s reading of 0.4%, while hours worked is forecast to remain unchanged at 34.4.
With such high stakes surrounding the report, the market will likely have a big reaction to the upside or downside based on how the number comes in relative to expectations. To that end, we just published our eleven-page monthly preview for the November jobs report. This report contains a ton of analysis related to how the equity market has historically reacted to the monthly jobs report, as well as how secondary employment-related indicators we track looked in September. We also include a breakdown of how the initial reading for September typically comes in relative to expectations and how that ranks versus other months.
For anyone with more than a passing interest in how equities are impacted by economic data, this report is a must read. To see the report, sign up for a monthly Bespoke Premium membership and get 10% off for life ($89/month).
Chart of the Day: Biotech Rolling Over?
Bespoke’s Consumer Pulse Report — November 2016
Bespoke’s Consumer Pulse Report is an analysis of a huge consumer survey that we run each month. Our goal with this survey is to track trends across the economic and financial landscape in the US. Using the results from our proprietary monthly survey, we dissect and analyze all of the data and publish the Consumer Pulse Report, which we sell access to on a subscription basis. Sign up for a 30-day free trial to our Bespoke Consumer Pulse subscription service here. With a trial, you’ll get coverage of consumer electronics, social media, streaming media, retail, autos, and much more.

November Auto Sales Off To A Solid Start
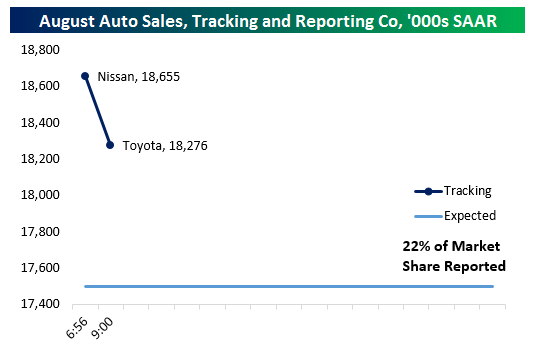
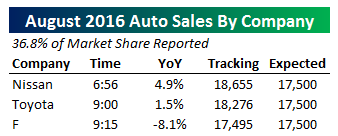 Early numbers from the auto industry are showing solid sales numbers for the month of November, improving on last month’s sales pace (per the BEA) of 17.91mm units at a seasonally adjusted annual rate. So far just three companies (Nissan, Ford, and Toyota) have reported sales and all are showing respectable mid-single digit YoY sales gains (which are not adjusted for selling days). By our math, auto sales are tracking a beat versus estimates of a bit more than 200,000 units SAAR (which adjusts for both seasonal buying trends and the number of sales days in the month). The highest sales pace of the current economic expansion came one year ago, when SAAR was reported at 18.3mm units. Depending on how things go the rest of the day, that record may fall. Even if it doesn’t, the auto industry looks to have firmed markedly over the last few months.
Update 1 9:54 AM EST: While GM reported a solid quarter which boosted our tracker above 18.2mm SAAR, Fiat-Chrysler laid a massive egg, delivering -14% YoY sales versus -9% expected by analysts. As a result, our tracker has collapsed down to 17.54mm SAAR, a huge drop for a single company. However, with Fiat-Chrysler composing almost 15% of the industry, large misses from that company can drive big changes. We’ll continue to update our tracker throughout the day as more companies publish their numbers.
Update 2 10:38 AM EST: Fiat-Chrysler’s terrible sales month wasn’t enough to keep our SAAR tracker down for long. Strong reports from Honda (though slightly below estimates) and VW (receiving a favorable base effect from last years’s diesel scandal sales plunge) have pushed our tracker back to just above estimated sales volumes with a bit less than 80% of the market reported. Other than FCUA, the industry as a whole has delivered pretty strong sales for the month of November.
Update 4 2:25 PM EST: Smaller automakers delivered mixed results later in the reporting day as BMW delivered brutal results but Mazda, Mercedes, Mitsubishi, and Hyundai were about in-line with the industry sales pace. Both KIA and Subaru delivered strong performances, making up for BMW weakness. Overall, with over 98% of the industry reported, we are tracking a 17.70mm SAAR, exactly on-expectations entering the day. As we noted above, those estimates would have been beaten were it not for a horrible showing from Fiat-Chrysler. Overall the auto industry looks to be on respectable footing in terms of unit volume.
Final Update 2:42 PM EST: We had previously said the above update would be our final one but Porsche announced a record-setting month of sales that took total SAAR tracking to 17.72mm SAAR; therefore we’ll close out our tracking here with that figure included and 98.9% of market share reported.
Surge in Bullish Sentiment Takes a Breather
Like our free content? You’ll like Bespoke Premium even more! Click here to start a no-obligation 14-day free trial now.
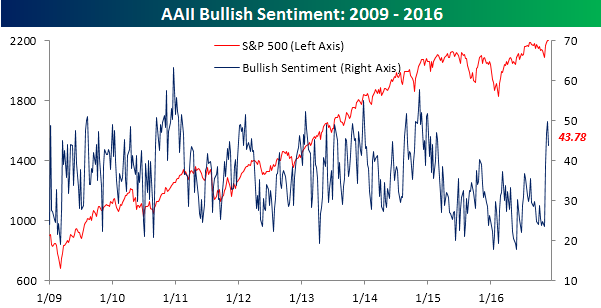
Individual investors hopped off the Trump rally train a little bit this week, as the AAII bullish reading dropped 6.1 percentage points from 49.89% down to 43.78%. So after nearly eclipsing 50% for the first time since January 2015, it looks like we are going to have to wait at least another week before half of individual investors are on the bullish bandwagon. It’s really pretty remarkable when you think about it, that despite all the big gains we have seen in stocks, that bullish sentiment has yet to eclipse 50%.
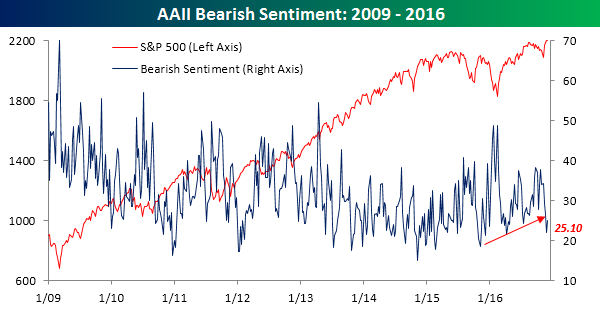
As one might expect, with the drop in bullish sentiment, bearish sentiment ticked higher this week, but by only half of the magnitude of the increase in bullish sentiment. As shown in the chart below, bearish sentiment increased from 28.03% up to 31.12%, but still remains below the uptrend that it broke below last week.
Jobless Claims Up For Second Straight Week
Like our free content? You’ll like Bespoke Premium even more! Click here to start a no-obligation 14-day free trial now.
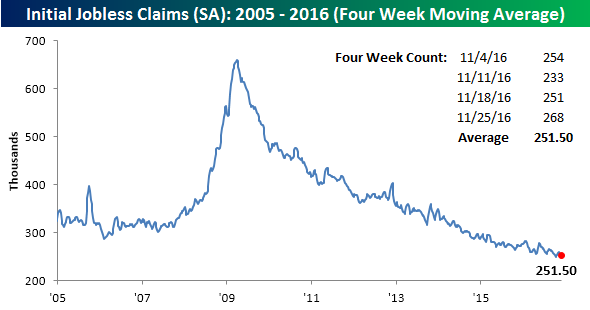
Jobless claims unexpectedly rose again this week, rising by 17K to 268K versus consensus estimates of 253K. This marks the second straight week of increases in the high teens and is the largest two-week increase since the first week of May. Even with the increase, though, jobless claims remain comfortably below 300K as they have for the last 91 weeks! Until claims start nearing 300K, the market is unlikely to worry too much on this front.
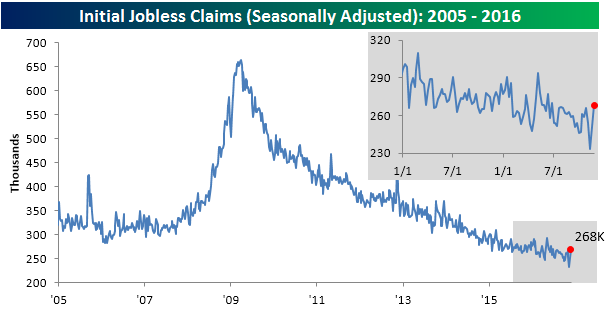
One of the more disappointing aspects of this week’s report is that a new low in the four-week moving average is now unlikely in the cards. In this week’s report, the four-week average only increased slightly (from 251K up to 251.5K), but over the coming weeks we will be dropping some much lower readings from the count. Therefore, even a small decline in the moving average down to the cycle low of 249K is unlikely.
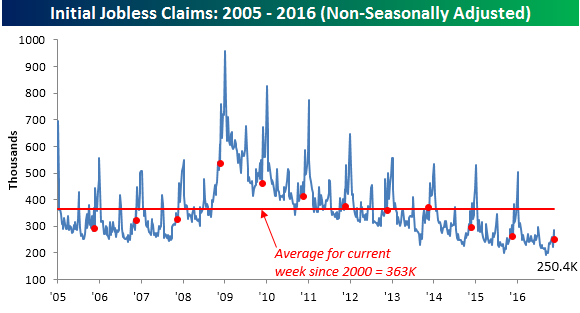
On a non-seasonally adjusted (NSA) basis, jobless claims fell by 37.4K to 250.4K. For the current week of the year, this is more than 100K below the average of 363.3 going back to 2000, and it is the lowest reading for the last week of November since 1972, so on the NSA front, it was still a good report.