Holiday Snooze-Fest for Markets
Get Bespoke’s 2017 Outlook Report with a 30-day free trial to Bespoke’s premium research! Click here to learn more.
The spread between the S&P 500’s intraday high and its intraday low today was just 0.26%. That ranks in the top 25 for most boring days over the last 30+ years (our intraday data goes back to 1984). It’s not surprising given the holidays. Markets nearly always die down at this time of year. You may remember the chart below if you’ve been reading Bespoke throughout the year — we’ve posted it a few times already. It shows the S&P 500’s average absolute percentage change for each trading day of the year going back to 1928. As you can see, daily volatility runs between +/-0.60% and +0.80% over the first two and a half quarters of the year before picking up significantly from late September through early November. Then we see the daily action fall off a cliff from mid-November through the end of the year, which is where we currently sit.
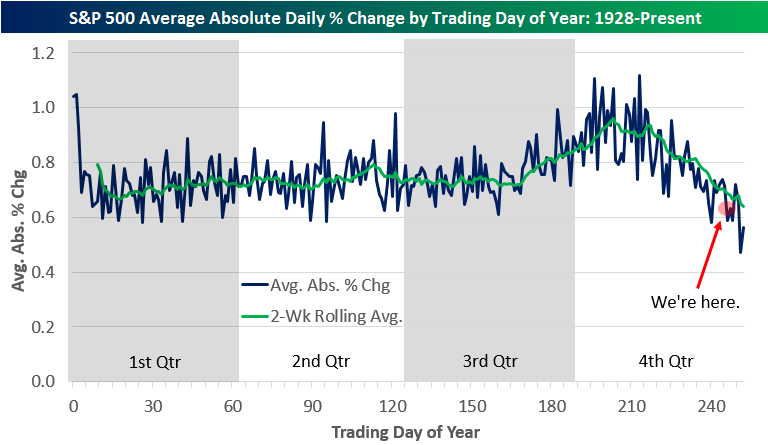
Chart of the Day: Sector Performance in Year One of Election Cycle
The Bespoke Report — 2017 — “Valuation”
 Our 2017 Bespoke Report market outlook is the most important piece of research that Bespoke publishes each year. We’ve been publishing our annual outlook piece since the formation of Bespoke in 2007, and it gets better and better each year! In this year’s edition, we’ll be covering every important topic you can think of dealing with financial markets as we enter 2017. And to say that 2017 should be an interesting year for asset classes would be an understatement given the huge rotation we’ve already seen in just a few weeks since the Presidential Election was held back on November 8th.
The 2017 Bespoke Report contains sections like Washington and Markets, Economic Cycles, Market Cycles, Washington, Sector Technicals and Weightings, Stock Market Sentiment, Stock Market Seasonality, Housing, Commodities, and more. In this year’s edition, we’ll also be featuring our new “Trump Index” of stocks that we expect to perform best in 2017 based on the new administration.
Over the next few weeks until the full publication is sent to paid members on December 29th, we’ll be releasing individual sections as we complete them. Today we have published the “Valuation” section of the 2017 Bespoke Report, which looks at a variety of different valuation metrics for the broader market as well as individual sectors. We answer just how overvalued (or undervalued?) this market really is.
To view this section immediately and also receive the full 2017 Bespoke Report when it’s published on December 29th, simply sign up for a 30-day free trial to Bespoke Premium. It’s that easy!
The Bespoke Report — 2017 — “The Year in Headlines”
Our 2017 Bespoke Report market outlook is the most important piece of research that Bespoke publishes each year. We’ve been publishing our annual outlook piece since the formation of Bespoke in 2007, and it gets better and better each year! In this year’s edition, we’ll be covering every important topic you can think of dealing with financial markets as we enter 2017. And to say that 2017 should be an interesting year for asset classes would be an understatement given the huge rotation we’ve already seen in just a few weeks since the Presidential Election was held back on November 8th.
The 2017 Bespoke Report contains sections like Washington and Markets, Economic Cycles, Market Cycles, The Fed, Sector Technicals and Weightings, Stock Market Sentiment, Stock Market Seasonality, Housing, Commodities, and more. In this year’s edition, we’ll also be featuring our new “Trump Index” of stocks that we expect to perform best in 2017 based on the new administration.
Over the next week until the full publication is sent to paid members on December 29th, we’ll be releasing individual sections as we complete them. Today we have published the “Year in Headlines” section of the 2017 Bespoke Report, which provides a month-by-month and day-by-day look at the major financial news headlines that impacted markets throughout 2016.
To view this section immediately and also receive the full 2017 Bespoke Report when it’s published on December 29th, simply sign up for a 30-day free trial to Bespoke Premium. It’s that easy!
ETF Trends: Fixed Income, Currencies, and Commodities – 12/21/16
Yield plays and riskier micro cap stocks have performed well over the past week with MLPs, Telecoms, REITs, and Micro Caps leading the charge. A variety of other small cap funds have also done well. Among the worst performers are gold miners, silver, and Asian country ETFs (Singapore, Malaysia, China).

Bespoke provides Bespoke Premium and Bespoke Institutional members with a daily ETF Trends report that highlights proprietary trend and timing scores for more than 200 widely followed ETFs across all asset classes. If you’re an ETF investor, this daily report is perfect. Sign up below to access today’s ETF Trends report.
See Bespoke’s full daily ETF Trends report by starting a no-obligation free trial to our premium research. Click here to sign up with just your name and email address.
Not So Lucky Sevens
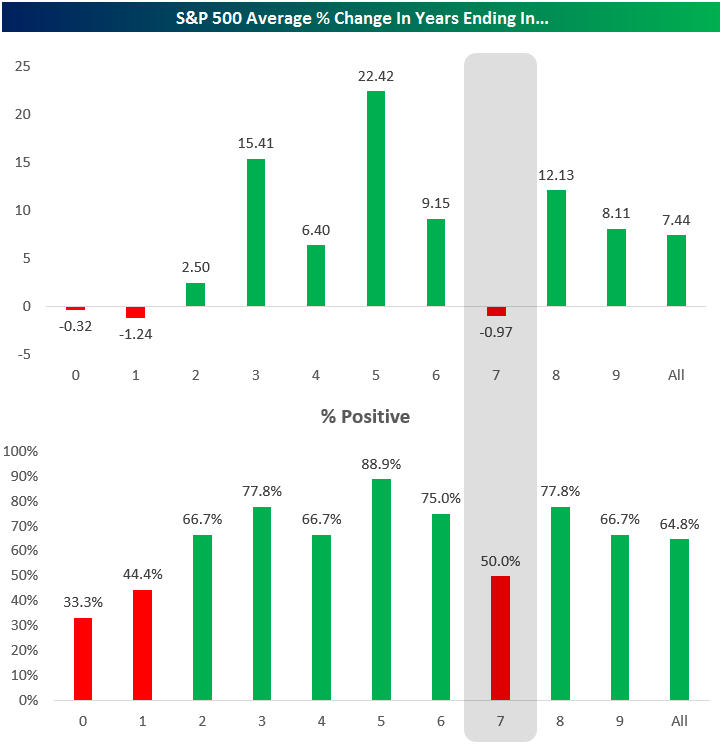
In working on our 2017 annual outlook report, we decided to take a quick look at how the S&P 500 has historically performed in years ending in “7” going back to 1928 when the index was formed. Unfortunately for market bulls, this is an instance where 7 is not a very lucky number. As shown below, the S&P has historically averaged a slight decline of 0.97% in years ending in 7, with gains occurring only half of the time. Years ending in “0” and “1” have also seen the S&P average a decline, and in these years the index has posted gains less than half the time.
So what has been the best year to be invested? Years ending in a “5” have averaged a mammoth gain of 22.42%, and the index has been up 88.9% of the time in these years (8 out of 9). Unfortunately we have to wait until 2025 to get the next one!
Want to see Bespoke’s 2017 annual outlook report? Click here to gain access with a 30-day free Bespoke research trial.
Dynamic Upgrades/Downgrades: 12/21/16
End of Year Winners and Losers
Get Bespoke’s 2017 Outlook Report with a 30-day free trial to Bespoke’s premium research! Click here to learn more.
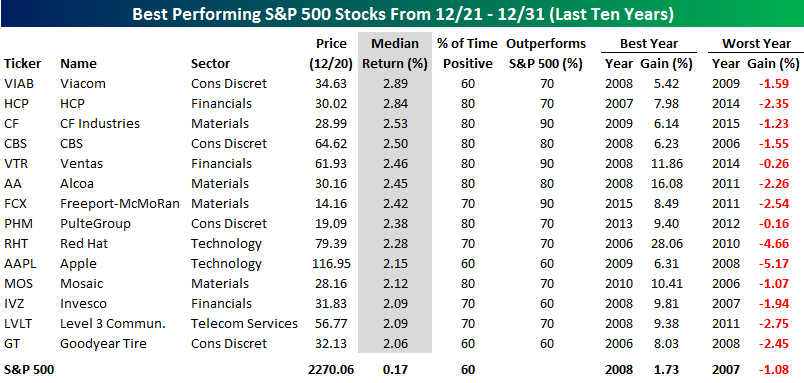
While December is typically a strong month for equities, most of the month’s gains have historically come prior to Christmas, while the last week of the year tends to be trendless with a slight positive bias. With just seven trading days left in the year, we wanted to highlight which stocks in the S&P 500 have historically seen the best and worst returns from the close on 12/21 through the end of December over the last ten years. The first table below lists the 14 stocks in the index that have seen a median gain of 2% or more during this period, and for each stock, we include the year where it saw its best and worst gains.
Topping the list of winning stocks to close out the year, shares of Viacom (VIAB) have seen a median gain of 2.89% with positive returns 60% of the time. The stock had its best end-of-year gain in 2008 when it rallied 5.4% and its worst in 2009 when it fell 1.59%. The most notable name on the list of winners, however, is Apple (AAPL). Over the last ten years, the stock has seen a median gain of 2.15% with positive returns 60% of the time. AAPL’s best end to a year was in 2009 (6.31%) while its worst was 2008 (-5.17%). In terms of sector representation, both the Consumer Discretionary and Materials sectors account for four of the fourteen stocks listed.
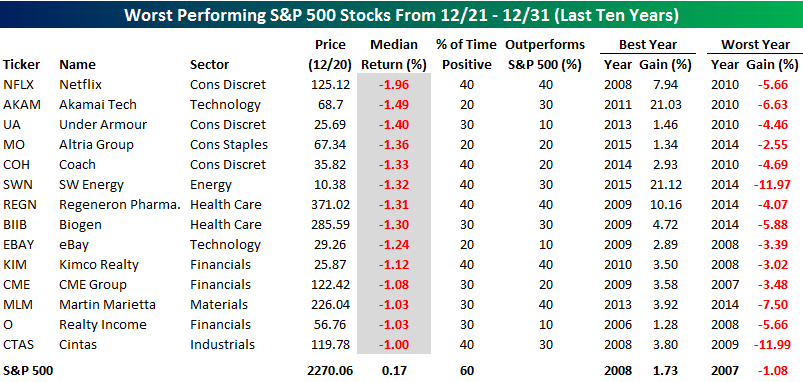
On the downside, fourteen stocks in the S&P 500 have seen a median decline of 1% or more to end the year. Surprisingly, Netflix (NFLX) tops the list of losers with a median decline of 1.96% and positive returns just 40% of the time. The next worst performer has been Akamai (AKAM), which has seen a median decline of 1.49% with positive returns just twice. Along with Altria (MO) and eBay (EBAY), AKAM is the least consistent to the upside of the stocks listed.
Netflix (NFLX) Crosses 50%
Each month, Bespoke runs a survey of 1,500 US consumers balanced to census. In the survey, we cover everything you can think of regarding the economy, personal finances, and consumer spending habits. We’ve now been running the monthly survey for more than two years, so we have historical trend data that is extremely valuable, and it only gets more valuable as time passes. All of this data gets packaged into our monthly Bespoke Consumer Pulse Report, which is included as part of our Pulse subscription package that is available for either $39/month or $365/year. We highly recommend trying out the service, as it includes access to model portfolios and additional consumer reports as well. If you’re not yet a Pulse member, click here to start a 30-day free trial now!
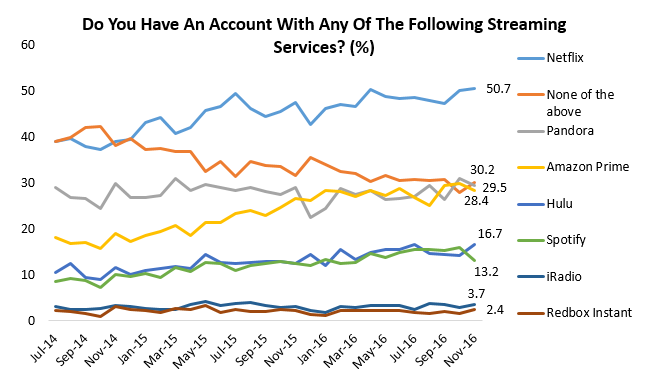
Yesterday we highlighted our Pulse survey data on social media account trends, and today we’re taking a look at account trends for streaming media services. Each month in our survey, we ask participants if they have an account with any of the streaming media platforms shown in the chart below. Netflix (NFLX) is to streaming as Facebook (FB) is to social as Amazon.com (AMZN) is to e-commerce. More than 50% of survey participants have a Netflix account, which is a massive number. Back in late 2014 this reading was less than 40%, so Netflix continues to trend higher but hasn’t yet hit critical mass in our opinion. Looking at the remaining services, we’ve seen Amazon Prime, Hulu and Spotify all trend higher as well over the past two years, while Pandora (P) is essentially flat. The percentage of consumers that didn’t have an account with any of the services in the chart has dipped from the mid-40s to 30.2% as of November.
If you’re not yet a Pulse member and would like to track our streaming media data going forward, click here to start a 30-day free trial now!
The Closer 12/20/16 – Nothing Up With VIX
Log-in here if you’re a member with access to the Closer.
Looking for deeper insight on global markets and economics? In tonight’s Closer sent to Bespoke Institutional clients, we dive deep on the VIX curve.

The Closer is one of our most popular reports, and you can see it and everything else Bespoke publishes by starting a no-obligation 14-day free trial to our research!