Chart of the Day – Stampeding on to the Stock Market Bandwagon
Stock Seasonality Report: 12/27/16
Two Impressive Streaks Involving Eight
Get Bespoke’s 2017 Outlook Report with a 30-day free trial to Bespoke’s premium research! Click here to learn more.
Welcome back from the Holiday break! With just four trading days left in 2016, the Dow Jones Industrial Average (DJIA) hasn’t had a down week since the election and enters today riding a seven-week winning streak where it has rallied over 12%. If the Dow finishes in the green this week, it will be the longest weekly winning streak for the index (on a total return basis) since November 2013 (also eight weeks).
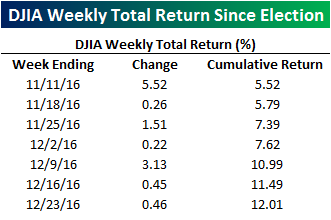
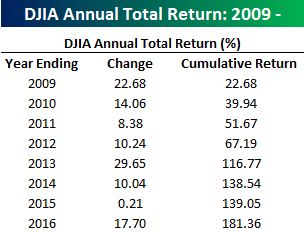
Naturally, with stocks up every week since the election, Donald Trump has been taking a lot of credit for the rally, and why shouldn’t he? It’s hard to justify any other catalyst for the market’s strength. On the subject of winning streaks, the Dow is also on the verge of completing an even more impressive streak involving the number eight. With a total return of 17.7% already YTD, the Dow will finish up 2016 with its eighth straight year of gains (barring a cataclysmic crash), and over that span, it has rallied more than 180%. So while Trump can boast about an eight-week winning streak, you can bet that in the last remaining weeks of President Obama’s time in office, he and his surrogates will be boasting about an eight-year winning streak for stocks under his (and the FOMC’s) watch.
Wall Street Strategists Bearish on 2017?
Get Bespoke’s 2017 Outlook Report with a 30-day free trial to Bespoke’s premium research! Click here to learn more.
We’re currently working on our annual outlook report, and one of the things we look at each year is Wall Street strategists’ year-end price targets. Our view on this is that predicting where the S&P 500 is going to be one month from now is hard enough, so trying to predict where prices will be a full year from now is a fool’s errand. Nevertheless, strategists do it, and we analyze it. While one strategist’s prediction doesn’t hold much weight, looking at the average of all the strategist’s predictions has a “wisdom of crowds” aspect to it.
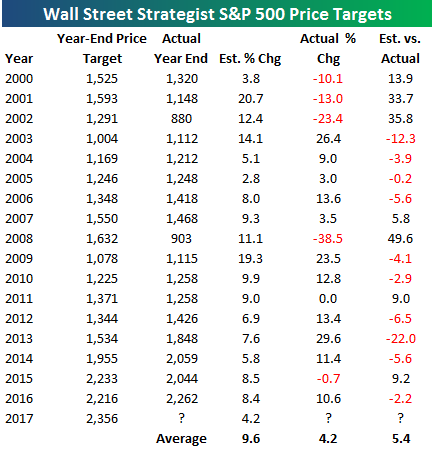
In that regards, below is a look at the average S&P 500 year-end price target of Wall Street strategists going back to the year 2000. For each year, we show the average year-end price target and what that would have translated into in terms of year-to-date percentage change. We also show where the S&P 500 actually ended the year in terms of price level and year-to-date change, and then we show the difference between the expected YTD change from strategists and the actual YTD change.
A couple of things stand out right away when looking at the table. First off, there hasn’t been one year in the last 17 where strategists were collectively expecting the S&P 500 to decline. The most bearish they’ve been was in 2005 when the average year-end price target was looking for a gain of just 2.8%. Second, the average expected change over all 17 years has been +9.6%. That’s 5.4 percentage points higher than the actual average annual gain of 4.2% that the S&P has experienced over the same time period.
At the start of 2016, the average year-end price target was predicting a gain of 8.4%, and if the year were to end today, they would have underestimated the market’s actual change by 2.2 percentage points. That’s actually a very good prediction compared to most years. The only year where strategists as a group called it closer was in 2005 when they missed the actual YTD change by just 0.2 percentage points.
The biggest misses for strategists came in years when the S&P entered bear markets. In 2001 and 2002, strategists were looking for double-digit percentage gains, but the S&P ended up posting double-digit percentage declines. In 2008, strategists were looking for a gain of 11.1%, and the S&P went on to fall 38.5% that year. The biggest under-estimation came in 2013 when the consensus call was for a gain of 7.6%. In that year the S&P rallied 29.6%, resulting in a miss of -22 percentage points.
This all brings us to 2017. As of now, the average Wall Street strategist has a year-end price target of 2,356. Based on the S&P’s current level, that translates into a 2017 gain of 4.2%, which coincidentally is the same as the average actual annual move that the S&P has experienced going back to 2000. Compared to the average expected gain of 9.6% that strategists have predicted over the last 17 years, their outlook for 2017 is relatively bearish. It would be the smallest expected gain of the entire bull market, and the smallest reading seen since 2005.
While we’ve seen wildly positive sentiment in many of the investor and consumer surveys released recently, it appears that Wall Street strategists don’t have high expectations for the stock market in the year ahead.
See additional Wall Street sentiment analysis in our 2017 annual outlook report due out this week! Click here to learn more.
Bespoke’s Country Trading Range Screen — Back to Oversold
Get Bespoke’s 2017 Outlook Report with a 30-day free trial to Bespoke’s premium research! Click here to learn more.
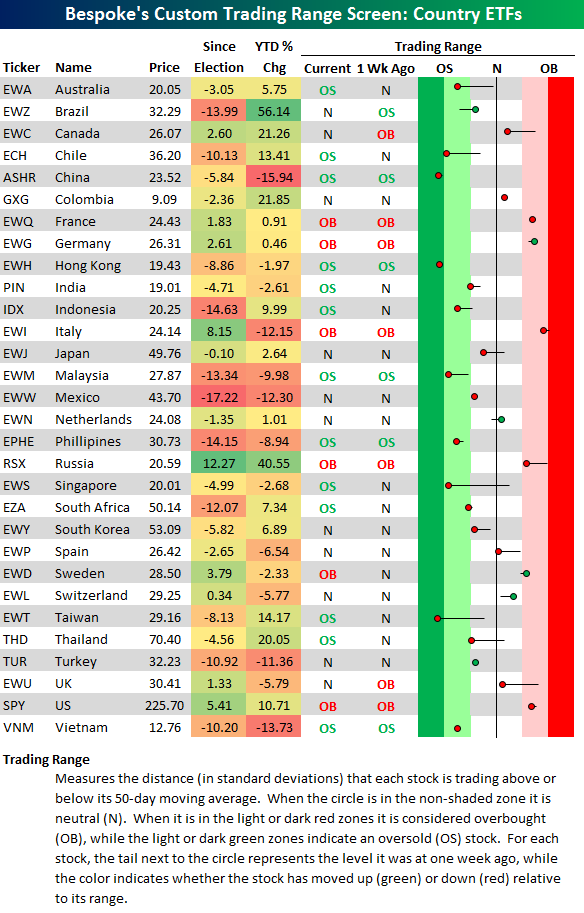
With markets closed today, it’s a good time to provide an update of our country ETF trading range screen that shows where global equity markets stand heading into the final trading week of the year. In the screen, the dot represents where each ETF is currently trading within its range, while the tail end represents where it was trading one week ago. The black vertical “N” line represents each ETF’s 50-day moving average. When the price is above the 50-day, the ETF is thought to be in a short-term uptrend, while a price below the 50-day means it’s in a short-term downtrend. Moves into the red or green zones are considered overbought or oversold.
While the US (SPY) is entering the final week of the year in overbought territory, the number of countries that are oversold is more than double the number that are overbought. And only 12 of the 30 countries in our screen are above their 50-day moving averages. So while equity markets here in the US have been doing fine, that’s not necessarily the case in other areas of the world. Asian markets have really been struggling lately, with China (ASHR), Hong Kong (EWH) and Taiwan (EWT) all trading in extreme oversold territory.
Outside of Russia (RSX), Italy (EWI), and the US (SPY), most country ETFs traded here on US exchanges are either flat or down since the election.
Quick View Chart Book – 12/24/16
The Bespoke Report — 2017 — “Economic Indicators”
 Our 2017 Bespoke Report market outlook is the most important piece of research that Bespoke publishes each year. We’ve been publishing our annual outlook piece since the formation of Bespoke in 2007, and it gets better and better each year! In this year’s edition, we’ll be covering every important topic you can think of dealing with financial markets as we enter 2017. And to say that 2017 should be an interesting year for asset classes would be an understatement given the huge rotation we’ve already seen in just a few weeks since the Presidential Election was held back on November 8th.
The 2017 Bespoke Report contains sections like Washington and Markets, Economic Cycles, Market Cycles, Washington, Sector Technicals and Weightings, Stock Market Sentiment, Stock Market Seasonality, Housing, Commodities, and more. In this year’s edition, we’ll also be featuring our new “Trump Index” of stocks that we expect to perform best in 2017 based on the new administration.
Over the next week until the full publication is sent to paid members on December 29th, we’ll be releasing individual sections as we complete them. Today we have published the “Economic Indicators” section of the 2017 Bespoke Report, which provides an in-depth analysis of more than 25 widely followed indicators across manufacturing, employment, inflation, sentiment, and housing. This one is a must-read.
To view this section immediately and also receive the full 2017 Bespoke Report when it’s published on December 29th, simply sign up for a 30-day free trial to Bespoke Premium. It’s that easy!
The Bespoke Report — 2017 — “Sentiment”
Our 2017 Bespoke Report market outlook is the most important piece of research that Bespoke publishes each year. We’ve been publishing our annual outlook piece since the formation of Bespoke in 2007, and it gets better and better each year! In this year’s edition, we’ll be covering every important topic you can think of dealing with financial markets as we enter 2017. And to say that 2017 should be an interesting year for asset classes would be an understatement given the huge rotation we’ve already seen in just a few weeks since the Presidential Election was held back on November 8th.
The 2017 Bespoke Report contains sections like Washington and Markets, Economic Cycles, Market Cycles, Washington, Sector Technicals and Weightings, Stock Market Sentiment, Stock Market Seasonality, Housing, Commodities, and more. In this year’s edition, we’ll also be featuring our new “Trump Index” of stocks that we expect to perform best in 2017 based on the new administration.
Over the next week until the full publication is sent to paid members on December 29th, we’ll be releasing individual sections as we complete them. Today we have published the “Sentiment” section of the 2017 Bespoke Report, which is certainly a big topic given the spike in optimism readings we’ve seen since the election for both investors and consumers.
To view this section immediately and also receive the full 2017 Bespoke Report when it’s published on December 29th, simply sign up for a 30-day free trial to Bespoke Premium. It’s that easy!
B.I.G. Tips – The Cost of Waiting for a Pullback
Overbought into Holidays
Get Bespoke’s 2017 Outlook Report with a 30-day free trial to Bespoke’s premium research! Click here to learn more.
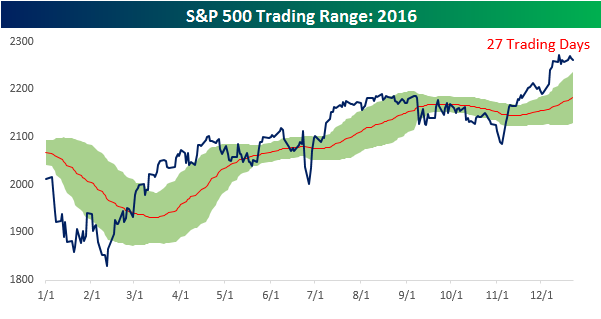
Dow 20,000 watch continues as we head into the Holiday weekend as the major averages struggle to advance amid extended overbought conditions. As shown in the trading range charts below, both the DJIA and S&P 500 have been trading in overbought (more than one standard deviation above 50-DMA) territory for several weeks now. For the DJIA, yesterday’s close was the 31st straight day that the index closed at overbought levels, which is a streak that has been in place since the election. Surprisingly enough, the current streak of overbought closes for the DJIA isn’t even the longest of the year. Back in April, the index ended a streak of 35 straight daily closes at overbought levels. For the sake of reference, based on current levels it would take a drop of about 400 points for the DJIA to trade back in its ‘normal’ range.
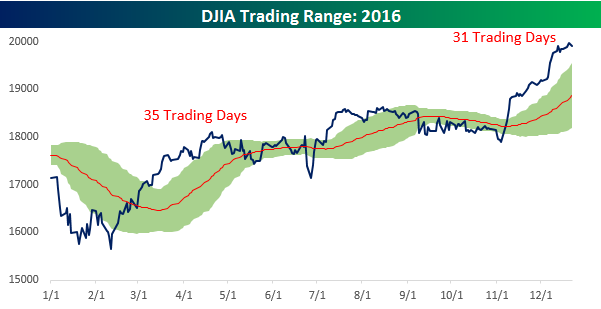
In the post-election rally, it took a little longer for the S&P 500 to hit overbought levels, so its current streak of overbought closes currently stands at just 27 days. While this streak is shorter, it still goes down as the longest streak of overbought closes for the S&P 500 since July 2014. In the case of the S&P 500, in order to fall back into neutral territory, the index would have to trade down about 25 points to 2,260.